Immigrants from Scotland vs Albanian 1st Grade
COMPARE
Immigrants from Scotland
Albanian
1st Grade
1st Grade Comparison
Immigrants from Scotland
Albanians
98.4%
1ST GRADE
99.8/ 100
METRIC RATING
55th/ 347
METRIC RANK
97.9%
1ST GRADE
49.6/ 100
METRIC RATING
176th/ 347
METRIC RANK
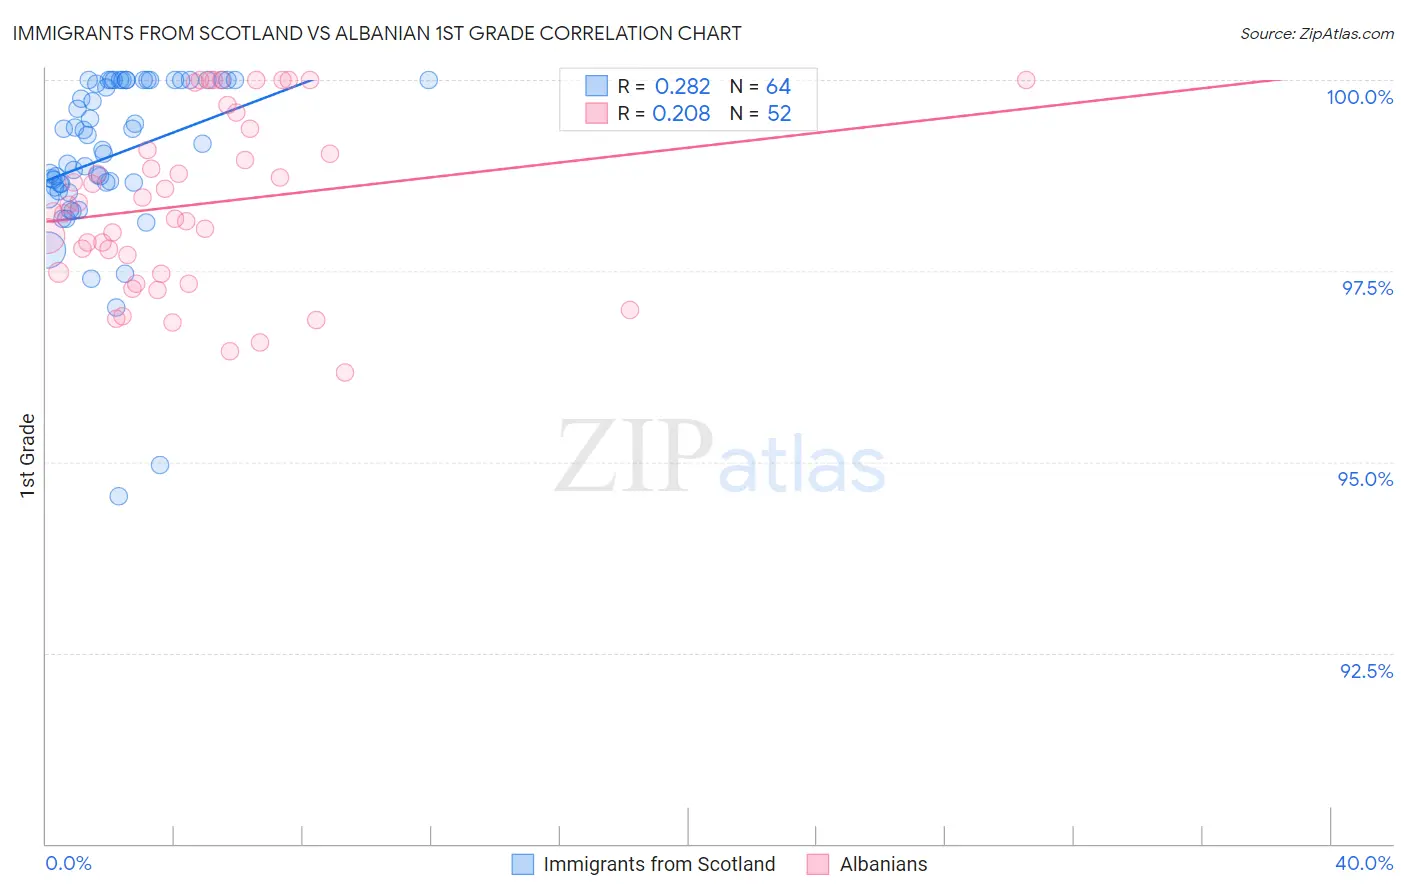
Immigrants from Scotland vs Albanian 1st Grade Correlation Chart
The statistical analysis conducted on geographies consisting of 196,398,887 people shows a weak positive correlation between the proportion of Immigrants from Scotland and percentage of population with at least 1st grade education in the United States with a correlation coefficient (R) of 0.282 and weighted average of 98.4%. Similarly, the statistical analysis conducted on geographies consisting of 193,265,850 people shows a weak positive correlation between the proportion of Albanians and percentage of population with at least 1st grade education in the United States with a correlation coefficient (R) of 0.208 and weighted average of 97.9%, a difference of 0.48%.
1st Grade Correlation Summary
| Measurement | Immigrants from Scotland | Albanian |
| Minimum | 94.6% | 96.2% |
| Maximum | 100.0% | 100.0% |
| Range | 5.4% | 3.8% |
| Mean | 99.0% | 98.4% |
| Median | 99.1% | 98.3% |
| Interquartile 25% (IQ1) | 98.6% | 97.5% |
| Interquartile 75% (IQ3) | 100.0% | 99.2% |
| Interquartile Range (IQR) | 1.4% | 1.8% |
| Standard Deviation (Sample) | 1.1% | 1.1% |
| Standard Deviation (Population) | 1.1% | 1.1% |
Similar Demographics by 1st Grade
Demographics Similar to Immigrants from Scotland by 1st Grade
In terms of 1st grade, the demographic groups most similar to Immigrants from Scotland are Pueblo (98.4%, a difference of 0.010%), Kiowa (98.4%, a difference of 0.010%), Australian (98.4%, a difference of 0.010%), American (98.4%, a difference of 0.010%), and Austrian (98.4%, a difference of 0.010%).
| Demographics | Rating | Rank | 1st Grade |
| Czechoslovakians | 99.8 /100 | #48 | Exceptional 98.4% |
| Celtics | 99.8 /100 | #49 | Exceptional 98.4% |
| Whites/Caucasians | 99.8 /100 | #50 | Exceptional 98.4% |
| Estonians | 99.8 /100 | #51 | Exceptional 98.4% |
| Pueblo | 99.8 /100 | #52 | Exceptional 98.4% |
| Kiowa | 99.8 /100 | #53 | Exceptional 98.4% |
| Australians | 99.8 /100 | #54 | Exceptional 98.4% |
| Immigrants | Scotland | 99.8 /100 | #55 | Exceptional 98.4% |
| Americans | 99.8 /100 | #56 | Exceptional 98.4% |
| Austrians | 99.8 /100 | #57 | Exceptional 98.4% |
| New Zealanders | 99.7 /100 | #58 | Exceptional 98.4% |
| Creek | 99.7 /100 | #59 | Exceptional 98.4% |
| Immigrants | Canada | 99.7 /100 | #60 | Exceptional 98.4% |
| Bulgarians | 99.7 /100 | #61 | Exceptional 98.4% |
| Slavs | 99.7 /100 | #62 | Exceptional 98.4% |
Demographics Similar to Albanians by 1st Grade
In terms of 1st grade, the demographic groups most similar to Albanians are Kenyan (97.9%, a difference of 0.0%), Native/Alaskan (97.9%, a difference of 0.0%), Immigrants from Sri Lanka (97.9%, a difference of 0.0%), Immigrants from Brazil (97.9%, a difference of 0.0%), and Immigrants from Jordan (97.9%, a difference of 0.010%).
| Demographics | Rating | Rank | 1st Grade |
| Immigrants | Micronesia | 55.3 /100 | #169 | Average 97.9% |
| Immigrants | Spain | 54.9 /100 | #170 | Average 97.9% |
| Immigrants | Jordan | 53.9 /100 | #171 | Average 97.9% |
| Immigrants | Korea | 53.0 /100 | #172 | Average 97.9% |
| Kenyans | 51.2 /100 | #173 | Average 97.9% |
| Natives/Alaskans | 50.0 /100 | #174 | Average 97.9% |
| Immigrants | Sri Lanka | 49.7 /100 | #175 | Average 97.9% |
| Albanians | 49.6 /100 | #176 | Average 97.9% |
| Immigrants | Brazil | 49.1 /100 | #177 | Average 97.9% |
| Immigrants | Venezuela | 47.8 /100 | #178 | Average 97.9% |
| Argentineans | 47.2 /100 | #179 | Average 97.9% |
| Immigrants | Bosnia and Herzegovina | 46.6 /100 | #180 | Average 97.9% |
| Portuguese | 44.2 /100 | #181 | Average 97.9% |
| Egyptians | 42.7 /100 | #182 | Average 97.9% |
| Immigrants | Argentina | 41.3 /100 | #183 | Average 97.9% |