Immigrants from South Africa vs Immigrants from Brazil Nursery School
COMPARE
Immigrants from South Africa
Immigrants from Brazil
Nursery School
Nursery School Comparison
Immigrants from South Africa
Immigrants from Brazil
98.3%
NURSERY SCHOOL
98.8/ 100
METRIC RATING
89th/ 347
METRIC RANK
98.0%
NURSERY SCHOOL
51.3/ 100
METRIC RATING
172nd/ 347
METRIC RANK
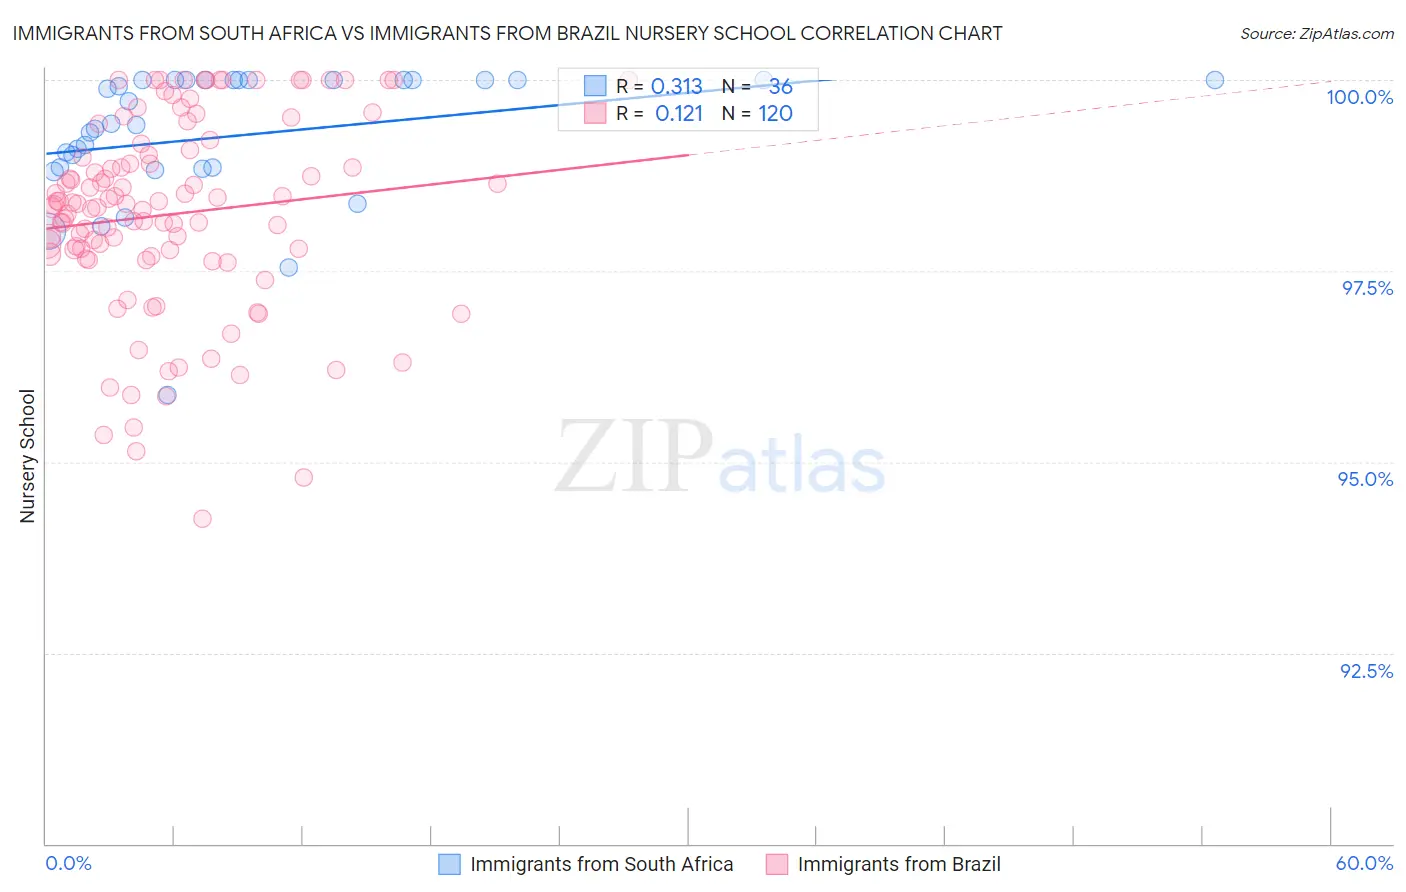
Immigrants from South Africa vs Immigrants from Brazil Nursery School Correlation Chart
The statistical analysis conducted on geographies consisting of 233,321,693 people shows a mild positive correlation between the proportion of Immigrants from South Africa and percentage of population with at least nursery school education in the United States with a correlation coefficient (R) of 0.313 and weighted average of 98.3%. Similarly, the statistical analysis conducted on geographies consisting of 343,021,580 people shows a poor positive correlation between the proportion of Immigrants from Brazil and percentage of population with at least nursery school education in the United States with a correlation coefficient (R) of 0.121 and weighted average of 98.0%, a difference of 0.33%.
Nursery School Correlation Summary
| Measurement | Immigrants from South Africa | Immigrants from Brazil |
| Minimum | 95.9% | 94.3% |
| Maximum | 100.0% | 100.0% |
| Range | 4.1% | 5.7% |
| Mean | 99.3% | 98.2% |
| Median | 99.4% | 98.4% |
| Interquartile 25% (IQ1) | 98.8% | 97.7% |
| Interquartile 75% (IQ3) | 100.0% | 99.1% |
| Interquartile Range (IQR) | 1.2% | 1.3% |
| Standard Deviation (Sample) | 0.91% | 1.3% |
| Standard Deviation (Population) | 0.90% | 1.3% |
Similar Demographics by Nursery School
Demographics Similar to Immigrants from South Africa by Nursery School
In terms of nursery school, the demographic groups most similar to Immigrants from South Africa are Hopi (98.3%, a difference of 0.0%), Ukrainian (98.3%, a difference of 0.0%), Immigrants from Western Europe (98.3%, a difference of 0.0%), Zimbabwean (98.3%, a difference of 0.0%), and Immigrants from Australia (98.3%, a difference of 0.010%).
| Demographics | Rating | Rank | Nursery School |
| Potawatomi | 99.2 /100 | #82 | Exceptional 98.3% |
| Osage | 99.1 /100 | #83 | Exceptional 98.3% |
| Immigrants | Denmark | 99.1 /100 | #84 | Exceptional 98.3% |
| Immigrants | Sweden | 99.1 /100 | #85 | Exceptional 98.3% |
| Immigrants | Australia | 99.0 /100 | #86 | Exceptional 98.3% |
| Hopi | 98.9 /100 | #87 | Exceptional 98.3% |
| Ukrainians | 98.9 /100 | #88 | Exceptional 98.3% |
| Immigrants | South Africa | 98.8 /100 | #89 | Exceptional 98.3% |
| Immigrants | Western Europe | 98.8 /100 | #90 | Exceptional 98.3% |
| Zimbabweans | 98.8 /100 | #91 | Exceptional 98.3% |
| Macedonians | 98.7 /100 | #92 | Exceptional 98.3% |
| Immigrants | India | 98.7 /100 | #93 | Exceptional 98.3% |
| Immigrants | Germany | 98.6 /100 | #94 | Exceptional 98.3% |
| South Africans | 98.6 /100 | #95 | Exceptional 98.3% |
| Cypriots | 98.3 /100 | #96 | Exceptional 98.3% |
Demographics Similar to Immigrants from Brazil by Nursery School
In terms of nursery school, the demographic groups most similar to Immigrants from Brazil are Kenyan (98.0%, a difference of 0.0%), Navajo (98.0%, a difference of 0.0%), Immigrants from Sri Lanka (98.0%, a difference of 0.0%), Immigrants from Venezuela (98.0%, a difference of 0.0%), and Spanish American (98.0%, a difference of 0.010%).
| Demographics | Rating | Rank | Nursery School |
| Chileans | 56.4 /100 | #165 | Average 98.0% |
| Spanish Americans | 55.6 /100 | #166 | Average 98.0% |
| Immigrants | Spain | 55.6 /100 | #167 | Average 98.0% |
| Immigrants | Micronesia | 55.0 /100 | #168 | Average 98.0% |
| Immigrants | Korea | 53.8 /100 | #169 | Average 98.0% |
| Bermudans | 53.7 /100 | #170 | Average 98.0% |
| Immigrants | Jordan | 53.4 /100 | #171 | Average 98.0% |
| Immigrants | Brazil | 51.3 /100 | #172 | Average 98.0% |
| Kenyans | 50.2 /100 | #173 | Average 98.0% |
| Navajo | 50.0 /100 | #174 | Average 98.0% |
| Immigrants | Sri Lanka | 49.9 /100 | #175 | Average 98.0% |
| Immigrants | Venezuela | 49.8 /100 | #176 | Average 98.0% |
| Albanians | 48.9 /100 | #177 | Average 98.0% |
| Natives/Alaskans | 48.6 /100 | #178 | Average 98.0% |
| Argentineans | 46.8 /100 | #179 | Average 98.0% |