Immigrants from South Africa vs Swiss Nursery School
COMPARE
Immigrants from South Africa
Swiss
Nursery School
Nursery School Comparison
Immigrants from South Africa
Swiss
98.3%
NURSERY SCHOOL
98.8/ 100
METRIC RATING
89th/ 347
METRIC RANK
98.6%
NURSERY SCHOOL
100.0/ 100
METRIC RATING
35th/ 347
METRIC RANK
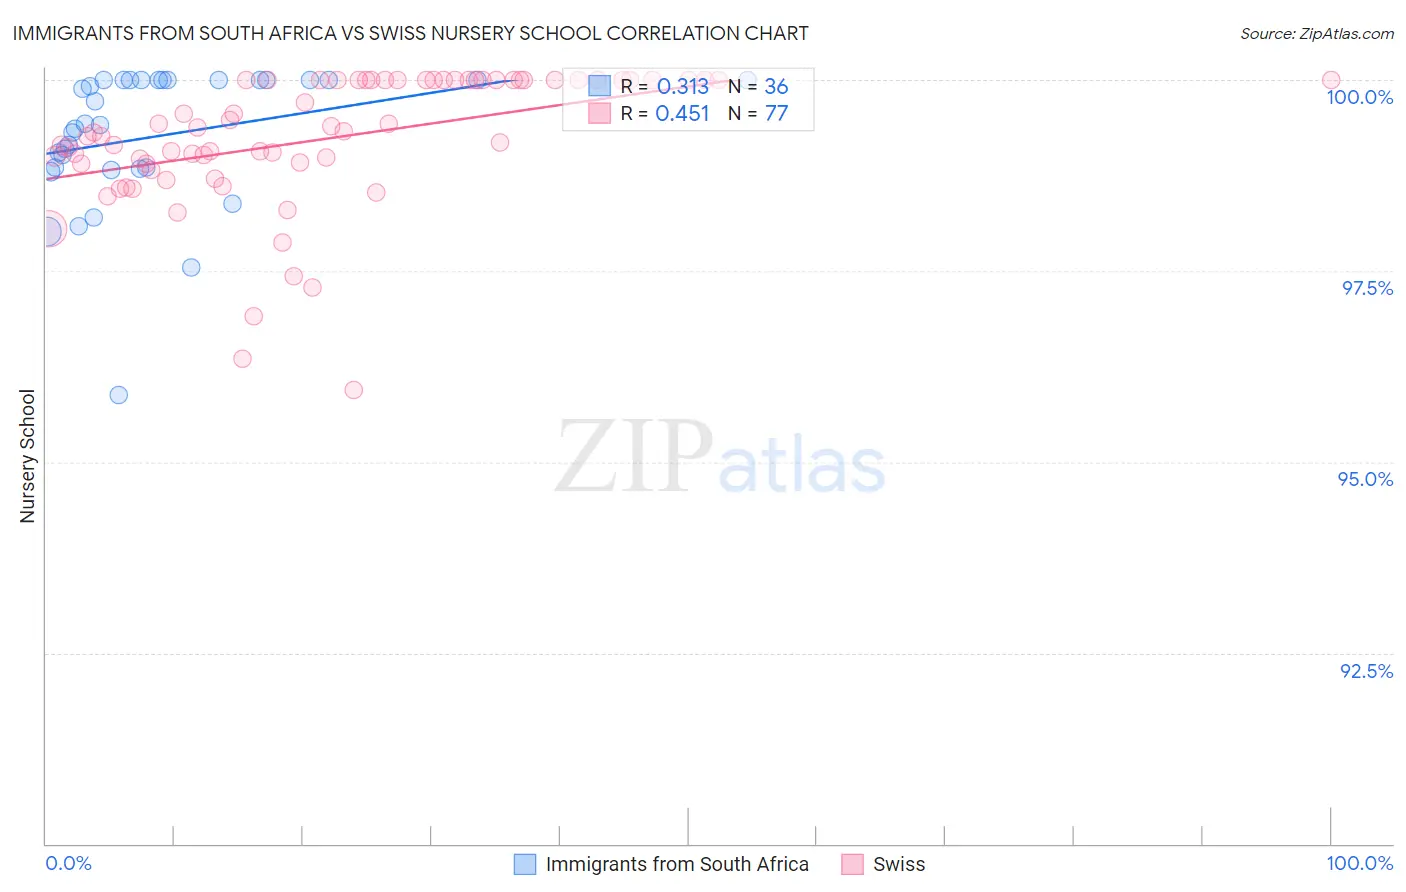
Immigrants from South Africa vs Swiss Nursery School Correlation Chart
The statistical analysis conducted on geographies consisting of 233,321,693 people shows a mild positive correlation between the proportion of Immigrants from South Africa and percentage of population with at least nursery school education in the United States with a correlation coefficient (R) of 0.313 and weighted average of 98.3%. Similarly, the statistical analysis conducted on geographies consisting of 465,023,158 people shows a moderate positive correlation between the proportion of Swiss and percentage of population with at least nursery school education in the United States with a correlation coefficient (R) of 0.451 and weighted average of 98.6%, a difference of 0.26%.
Nursery School Correlation Summary
| Measurement | Immigrants from South Africa | Swiss |
| Minimum | 95.9% | 95.9% |
| Maximum | 100.0% | 100.0% |
| Range | 4.1% | 4.1% |
| Mean | 99.3% | 99.2% |
| Median | 99.4% | 99.3% |
| Interquartile 25% (IQ1) | 98.8% | 98.9% |
| Interquartile 75% (IQ3) | 100.0% | 100.0% |
| Interquartile Range (IQR) | 1.2% | 1.1% |
| Standard Deviation (Sample) | 0.91% | 0.88% |
| Standard Deviation (Population) | 0.90% | 0.88% |
Similar Demographics by Nursery School
Demographics Similar to Immigrants from South Africa by Nursery School
In terms of nursery school, the demographic groups most similar to Immigrants from South Africa are Hopi (98.3%, a difference of 0.0%), Ukrainian (98.3%, a difference of 0.0%), Immigrants from Western Europe (98.3%, a difference of 0.0%), Zimbabwean (98.3%, a difference of 0.0%), and Immigrants from Australia (98.3%, a difference of 0.010%).
| Demographics | Rating | Rank | Nursery School |
| Potawatomi | 99.2 /100 | #82 | Exceptional 98.3% |
| Osage | 99.1 /100 | #83 | Exceptional 98.3% |
| Immigrants | Denmark | 99.1 /100 | #84 | Exceptional 98.3% |
| Immigrants | Sweden | 99.1 /100 | #85 | Exceptional 98.3% |
| Immigrants | Australia | 99.0 /100 | #86 | Exceptional 98.3% |
| Hopi | 98.9 /100 | #87 | Exceptional 98.3% |
| Ukrainians | 98.9 /100 | #88 | Exceptional 98.3% |
| Immigrants | South Africa | 98.8 /100 | #89 | Exceptional 98.3% |
| Immigrants | Western Europe | 98.8 /100 | #90 | Exceptional 98.3% |
| Zimbabweans | 98.8 /100 | #91 | Exceptional 98.3% |
| Macedonians | 98.7 /100 | #92 | Exceptional 98.3% |
| Immigrants | India | 98.7 /100 | #93 | Exceptional 98.3% |
| Immigrants | Germany | 98.6 /100 | #94 | Exceptional 98.3% |
| South Africans | 98.6 /100 | #95 | Exceptional 98.3% |
| Cypriots | 98.3 /100 | #96 | Exceptional 98.3% |
Demographics Similar to Swiss by Nursery School
In terms of nursery school, the demographic groups most similar to Swiss are Chinese (98.6%, a difference of 0.0%), Scandinavian (98.6%, a difference of 0.020%), British (98.5%, a difference of 0.020%), French (98.6%, a difference of 0.030%), and European (98.6%, a difference of 0.030%).
| Demographics | Rating | Rank | Nursery School |
| Croatians | 100.0 /100 | #28 | Exceptional 98.6% |
| French | 100.0 /100 | #29 | Exceptional 98.6% |
| Europeans | 100.0 /100 | #30 | Exceptional 98.6% |
| Czechs | 100.0 /100 | #31 | Exceptional 98.6% |
| French Canadians | 100.0 /100 | #32 | Exceptional 98.6% |
| Scandinavians | 100.0 /100 | #33 | Exceptional 98.6% |
| Chinese | 100.0 /100 | #34 | Exceptional 98.6% |
| Swiss | 100.0 /100 | #35 | Exceptional 98.6% |
| British | 100.0 /100 | #36 | Exceptional 98.5% |
| Lumbee | 99.9 /100 | #37 | Exceptional 98.5% |
| Italians | 99.9 /100 | #38 | Exceptional 98.5% |
| Latvians | 99.9 /100 | #39 | Exceptional 98.5% |
| Chippewa | 99.9 /100 | #40 | Exceptional 98.5% |
| Luxembourgers | 99.9 /100 | #41 | Exceptional 98.5% |
| Eastern Europeans | 99.9 /100 | #42 | Exceptional 98.5% |