Slovak vs Sierra Leonean Bachelor's Degree
COMPARE
Slovak
Sierra Leonean
Bachelor's Degree
Bachelor's Degree Comparison
Slovaks
Sierra Leoneans
37.3%
BACHELOR'S DEGREE
36.9/ 100
METRIC RATING
189th/ 347
METRIC RANK
40.1%
BACHELOR'S DEGREE
92.2/ 100
METRIC RATING
130th/ 347
METRIC RANK
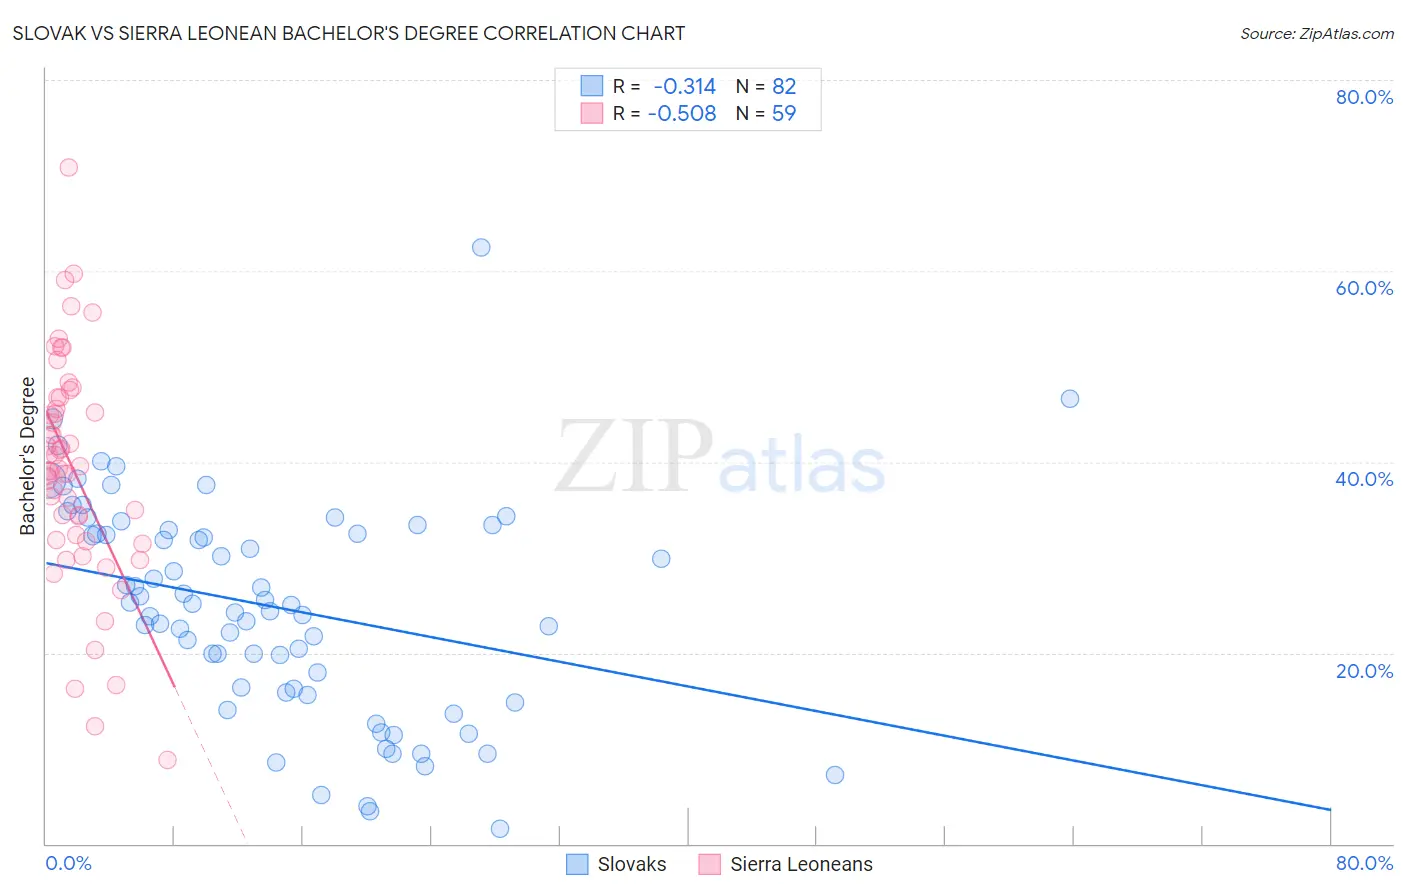
Slovak vs Sierra Leonean Bachelor's Degree Correlation Chart
The statistical analysis conducted on geographies consisting of 397,863,684 people shows a mild negative correlation between the proportion of Slovaks and percentage of population with at least bachelor's degree education in the United States with a correlation coefficient (R) of -0.314 and weighted average of 37.3%. Similarly, the statistical analysis conducted on geographies consisting of 83,362,711 people shows a substantial negative correlation between the proportion of Sierra Leoneans and percentage of population with at least bachelor's degree education in the United States with a correlation coefficient (R) of -0.508 and weighted average of 40.1%, a difference of 7.4%.
Bachelor's Degree Correlation Summary
| Measurement | Slovak | Sierra Leonean |
| Minimum | 1.5% | 8.8% |
| Maximum | 62.5% | 70.8% |
| Range | 61.0% | 62.1% |
| Mean | 24.8% | 39.2% |
| Median | 25.1% | 39.3% |
| Interquartile 25% (IQ1) | 16.2% | 31.8% |
| Interquartile 75% (IQ3) | 32.9% | 46.8% |
| Interquartile Range (IQR) | 16.7% | 15.0% |
| Standard Deviation (Sample) | 11.3% | 11.8% |
| Standard Deviation (Population) | 11.3% | 11.7% |
Similar Demographics by Bachelor's Degree
Demographics Similar to Slovaks by Bachelor's Degree
In terms of bachelor's degree, the demographic groups most similar to Slovaks are Immigrants from Oceania (37.3%, a difference of 0.050%), English (37.4%, a difference of 0.29%), Swiss (37.2%, a difference of 0.30%), Nigerian (37.2%, a difference of 0.32%), and Norwegian (37.5%, a difference of 0.36%).
| Demographics | Rating | Rank | Bachelor's Degree |
| Immigrants | Bosnia and Herzegovina | 43.4 /100 | #182 | Average 37.6% |
| Senegalese | 42.2 /100 | #183 | Average 37.5% |
| Scandinavians | 41.7 /100 | #184 | Average 37.5% |
| Immigrants | Peru | 41.3 /100 | #185 | Average 37.5% |
| Norwegians | 40.4 /100 | #186 | Average 37.5% |
| English | 39.7 /100 | #187 | Fair 37.4% |
| Immigrants | Oceania | 37.3 /100 | #188 | Fair 37.3% |
| Slovaks | 36.9 /100 | #189 | Fair 37.3% |
| Swiss | 34.1 /100 | #190 | Fair 37.2% |
| Nigerians | 33.9 /100 | #191 | Fair 37.2% |
| Immigrants | Vietnam | 32.1 /100 | #192 | Fair 37.1% |
| Yugoslavians | 31.5 /100 | #193 | Fair 37.1% |
| Belgians | 29.9 /100 | #194 | Fair 37.0% |
| Koreans | 29.8 /100 | #195 | Fair 37.0% |
| Celtics | 29.5 /100 | #196 | Fair 37.0% |
Demographics Similar to Sierra Leoneans by Bachelor's Degree
In terms of bachelor's degree, the demographic groups most similar to Sierra Leoneans are Serbian (40.1%, a difference of 0.070%), Italian (40.1%, a difference of 0.080%), Immigrants from Venezuela (40.2%, a difference of 0.24%), Taiwanese (40.0%, a difference of 0.33%), and Immigrants from Southern Europe (40.0%, a difference of 0.33%).
| Demographics | Rating | Rank | Bachelor's Degree |
| Lebanese | 94.3 /100 | #123 | Exceptional 40.4% |
| Immigrants | Eritrea | 94.3 /100 | #124 | Exceptional 40.4% |
| British | 94.2 /100 | #125 | Exceptional 40.4% |
| Immigrants | Eastern Africa | 94.1 /100 | #126 | Exceptional 40.4% |
| Immigrants | Jordan | 93.4 /100 | #127 | Exceptional 40.3% |
| Immigrants | Venezuela | 92.9 /100 | #128 | Exceptional 40.2% |
| Serbians | 92.4 /100 | #129 | Exceptional 40.1% |
| Sierra Leoneans | 92.2 /100 | #130 | Exceptional 40.1% |
| Italians | 91.9 /100 | #131 | Exceptional 40.1% |
| Taiwanese | 91.1 /100 | #132 | Exceptional 40.0% |
| Immigrants | Southern Europe | 91.1 /100 | #133 | Exceptional 40.0% |
| Assyrians/Chaldeans/Syriacs | 89.4 /100 | #134 | Excellent 39.8% |
| Luxembourgers | 89.1 /100 | #135 | Excellent 39.8% |
| Pakistanis | 88.2 /100 | #136 | Excellent 39.7% |
| Icelanders | 86.5 /100 | #137 | Excellent 39.5% |