Immigrants from Somalia vs Burmese 5th Grade
COMPARE
Immigrants from Somalia
Burmese
5th Grade
5th Grade Comparison
Immigrants from Somalia
Burmese
96.4%
5TH GRADE
0.0/ 100
METRIC RATING
295th/ 347
METRIC RANK
97.5%
5TH GRADE
86.1/ 100
METRIC RATING
140th/ 347
METRIC RANK
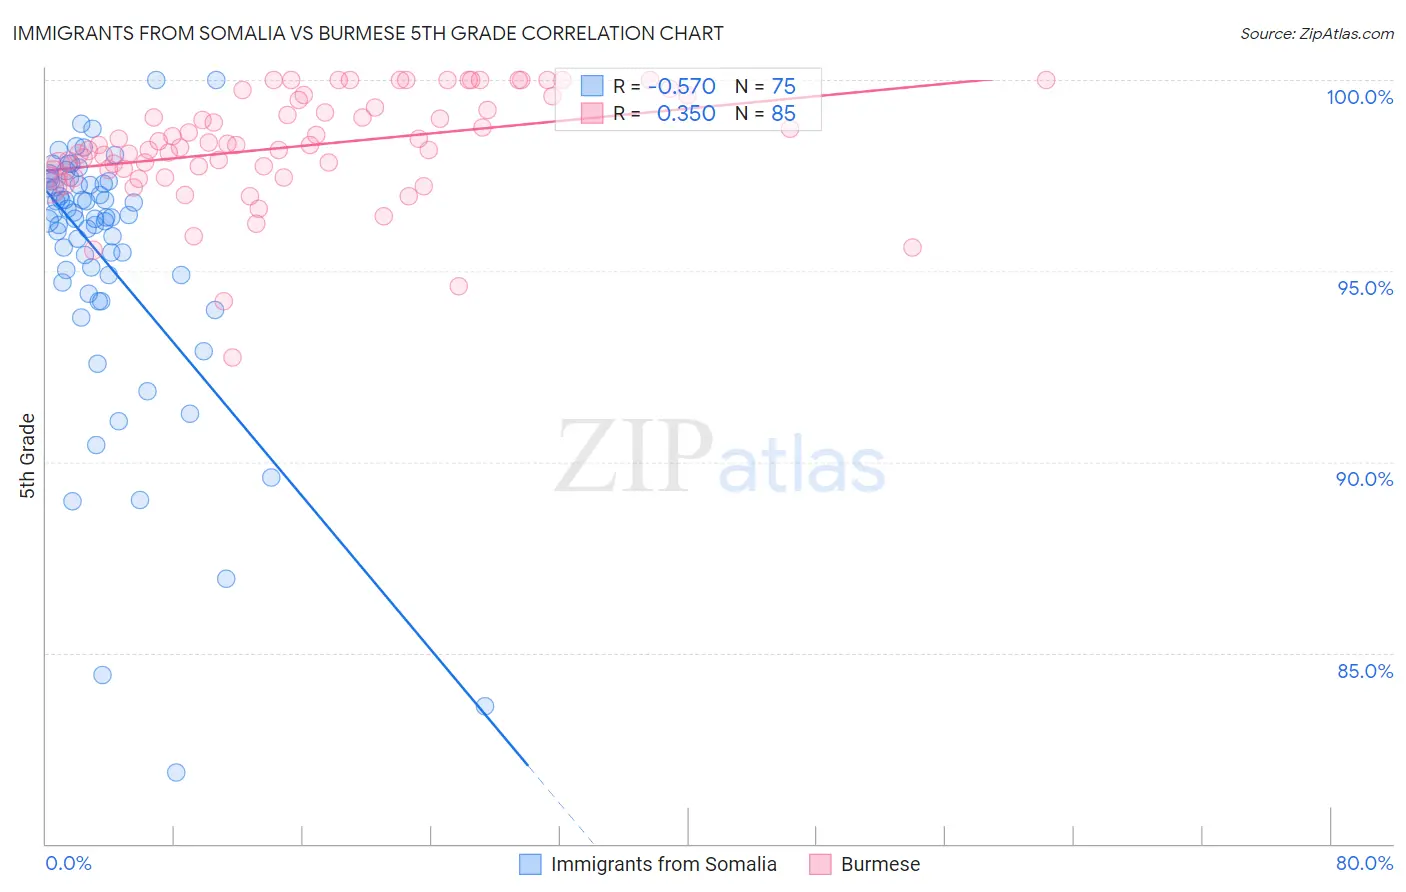
Immigrants from Somalia vs Burmese 5th Grade Correlation Chart
The statistical analysis conducted on geographies consisting of 92,109,166 people shows a substantial negative correlation between the proportion of Immigrants from Somalia and percentage of population with at least 5th grade education in the United States with a correlation coefficient (R) of -0.570 and weighted average of 96.4%. Similarly, the statistical analysis conducted on geographies consisting of 465,275,994 people shows a mild positive correlation between the proportion of Burmese and percentage of population with at least 5th grade education in the United States with a correlation coefficient (R) of 0.350 and weighted average of 97.5%, a difference of 1.2%.
5th Grade Correlation Summary
| Measurement | Immigrants from Somalia | Burmese |
| Minimum | 81.9% | 92.7% |
| Maximum | 100.0% | 100.0% |
| Range | 18.1% | 7.3% |
| Mean | 95.3% | 98.3% |
| Median | 96.4% | 98.3% |
| Interquartile 25% (IQ1) | 94.7% | 97.6% |
| Interquartile 75% (IQ3) | 97.3% | 99.5% |
| Interquartile Range (IQR) | 2.6% | 1.9% |
| Standard Deviation (Sample) | 3.5% | 1.4% |
| Standard Deviation (Population) | 3.5% | 1.4% |
Similar Demographics by 5th Grade
Demographics Similar to Immigrants from Somalia by 5th Grade
In terms of 5th grade, the demographic groups most similar to Immigrants from Somalia are Immigrants from Eritrea (96.4%, a difference of 0.040%), Immigrants from Grenada (96.5%, a difference of 0.080%), Malaysian (96.5%, a difference of 0.090%), Somali (96.5%, a difference of 0.090%), and British West Indian (96.5%, a difference of 0.10%).
| Demographics | Rating | Rank | 5th Grade |
| Immigrants | Barbados | 0.0 /100 | #288 | Tragic 96.6% |
| Immigrants | West Indies | 0.0 /100 | #289 | Tragic 96.5% |
| British West Indians | 0.0 /100 | #290 | Tragic 96.5% |
| Malaysians | 0.0 /100 | #291 | Tragic 96.5% |
| Somalis | 0.0 /100 | #292 | Tragic 96.5% |
| Immigrants | Grenada | 0.0 /100 | #293 | Tragic 96.5% |
| Immigrants | Eritrea | 0.0 /100 | #294 | Tragic 96.4% |
| Immigrants | Somalia | 0.0 /100 | #295 | Tragic 96.4% |
| Immigrants | South Eastern Asia | 0.0 /100 | #296 | Tragic 96.3% |
| Haitians | 0.0 /100 | #297 | Tragic 96.3% |
| Immigrants | Dominica | 0.0 /100 | #298 | Tragic 96.2% |
| Immigrants | Immigrants | 0.0 /100 | #299 | Tragic 96.2% |
| Sri Lankans | 0.0 /100 | #300 | Tragic 96.1% |
| Immigrants | Cuba | 0.0 /100 | #301 | Tragic 96.1% |
| Guyanese | 0.0 /100 | #302 | Tragic 96.1% |
Demographics Similar to Burmese by 5th Grade
In terms of 5th grade, the demographic groups most similar to Burmese are Seminole (97.5%, a difference of 0.0%), Israeli (97.5%, a difference of 0.0%), Immigrants from Moldova (97.5%, a difference of 0.010%), Filipino (97.5%, a difference of 0.010%), and Blackfeet (97.5%, a difference of 0.010%).
| Demographics | Rating | Rank | 5th Grade |
| Cambodians | 90.2 /100 | #133 | Exceptional 97.6% |
| Immigrants | Hungary | 90.1 /100 | #134 | Exceptional 97.6% |
| Palestinians | 89.3 /100 | #135 | Excellent 97.5% |
| Immigrants | Moldova | 87.5 /100 | #136 | Excellent 97.5% |
| Filipinos | 86.8 /100 | #137 | Excellent 97.5% |
| Blackfeet | 86.8 /100 | #138 | Excellent 97.5% |
| Immigrants | Turkey | 86.7 /100 | #139 | Excellent 97.5% |
| Burmese | 86.1 /100 | #140 | Excellent 97.5% |
| Seminole | 85.8 /100 | #141 | Excellent 97.5% |
| Israelis | 85.5 /100 | #142 | Excellent 97.5% |
| Immigrants | North Macedonia | 85.4 /100 | #143 | Excellent 97.5% |
| Immigrants | Greece | 83.2 /100 | #144 | Excellent 97.5% |
| Jordanians | 82.6 /100 | #145 | Excellent 97.5% |
| Spaniards | 81.9 /100 | #146 | Excellent 97.5% |
| Soviet Union | 81.2 /100 | #147 | Excellent 97.5% |