Immigrants from Singapore vs Immigrants from Eastern Europe 2nd Grade
COMPARE
Immigrants from Singapore
Immigrants from Eastern Europe
2nd Grade
2nd Grade Comparison
Immigrants from Singapore
Immigrants from Eastern Europe
98.1%
2ND GRADE
97.0/ 100
METRIC RATING
110th/ 347
METRIC RANK
97.9%
2ND GRADE
61.1/ 100
METRIC RATING
160th/ 347
METRIC RANK
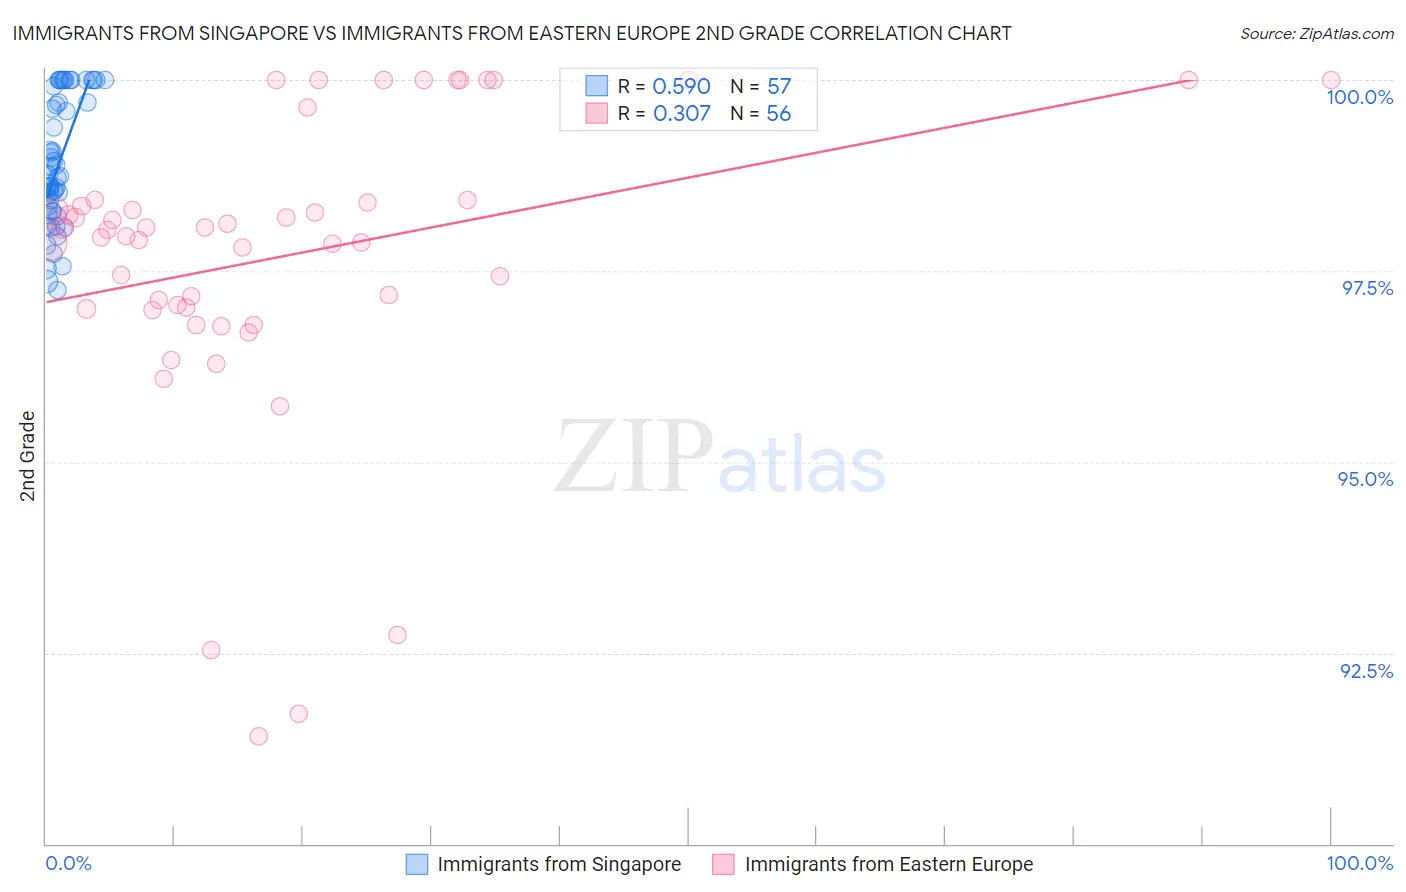
Immigrants from Singapore vs Immigrants from Eastern Europe 2nd Grade Correlation Chart
The statistical analysis conducted on geographies consisting of 137,521,700 people shows a substantial positive correlation between the proportion of Immigrants from Singapore and percentage of population with at least 2nd grade education in the United States with a correlation coefficient (R) of 0.590 and weighted average of 98.1%. Similarly, the statistical analysis conducted on geographies consisting of 475,879,420 people shows a mild positive correlation between the proportion of Immigrants from Eastern Europe and percentage of population with at least 2nd grade education in the United States with a correlation coefficient (R) of 0.307 and weighted average of 97.9%, a difference of 0.24%.
2nd Grade Correlation Summary
| Measurement | Immigrants from Singapore | Immigrants from Eastern Europe |
| Minimum | 97.2% | 91.4% |
| Maximum | 100.0% | 100.0% |
| Range | 2.8% | 8.6% |
| Mean | 98.9% | 97.7% |
| Median | 98.7% | 98.0% |
| Interquartile 25% (IQ1) | 98.3% | 97.0% |
| Interquartile 75% (IQ3) | 99.8% | 98.4% |
| Interquartile Range (IQR) | 1.5% | 1.4% |
| Standard Deviation (Sample) | 0.83% | 2.0% |
| Standard Deviation (Population) | 0.82% | 1.9% |
Similar Demographics by 2nd Grade
Demographics Similar to Immigrants from Singapore by 2nd Grade
In terms of 2nd grade, the demographic groups most similar to Immigrants from Singapore are Immigrants from Czechoslovakia (98.1%, a difference of 0.0%), Bhutanese (98.1%, a difference of 0.010%), German Russian (98.1%, a difference of 0.010%), Immigrants from Switzerland (98.1%, a difference of 0.010%), and Basque (98.1%, a difference of 0.010%).
| Demographics | Rating | Rank | 2nd Grade |
| Pima | 97.6 /100 | #103 | Exceptional 98.2% |
| Turks | 97.6 /100 | #104 | Exceptional 98.2% |
| Yugoslavians | 97.5 /100 | #105 | Exceptional 98.2% |
| Bhutanese | 97.5 /100 | #106 | Exceptional 98.1% |
| German Russians | 97.4 /100 | #107 | Exceptional 98.1% |
| Immigrants | Switzerland | 97.3 /100 | #108 | Exceptional 98.1% |
| Basques | 97.2 /100 | #109 | Exceptional 98.1% |
| Immigrants | Singapore | 97.0 /100 | #110 | Exceptional 98.1% |
| Immigrants | Czechoslovakia | 96.9 /100 | #111 | Exceptional 98.1% |
| Colville | 96.6 /100 | #112 | Exceptional 98.1% |
| Immigrants | Norway | 96.5 /100 | #113 | Exceptional 98.1% |
| Immigrants | Latvia | 96.4 /100 | #114 | Exceptional 98.1% |
| Iranians | 95.9 /100 | #115 | Exceptional 98.1% |
| Spanish | 95.8 /100 | #116 | Exceptional 98.1% |
| Ute | 95.7 /100 | #117 | Exceptional 98.1% |
Demographics Similar to Immigrants from Eastern Europe by 2nd Grade
In terms of 2nd grade, the demographic groups most similar to Immigrants from Eastern Europe are Immigrants from Russia (97.9%, a difference of 0.0%), Immigrants from Italy (97.9%, a difference of 0.0%), French American Indian (97.9%, a difference of 0.010%), Dutch West Indian (97.9%, a difference of 0.010%), and Venezuelan (97.9%, a difference of 0.010%).
| Demographics | Rating | Rank | 2nd Grade |
| Immigrants | South Central Asia | 68.3 /100 | #153 | Good 97.9% |
| Marshallese | 67.7 /100 | #154 | Good 97.9% |
| French American Indians | 64.3 /100 | #155 | Good 97.9% |
| Dutch West Indians | 63.8 /100 | #156 | Good 97.9% |
| Venezuelans | 63.3 /100 | #157 | Good 97.9% |
| Immigrants | Iran | 62.8 /100 | #158 | Good 97.9% |
| Comanche | 62.8 /100 | #159 | Good 97.9% |
| Immigrants | Eastern Europe | 61.1 /100 | #160 | Good 97.9% |
| Immigrants | Russia | 60.3 /100 | #161 | Good 97.9% |
| Immigrants | Italy | 60.2 /100 | #162 | Good 97.9% |
| Bermudans | 59.4 /100 | #163 | Average 97.9% |
| Ugandans | 56.6 /100 | #164 | Average 97.9% |
| Spanish Americans | 56.4 /100 | #165 | Average 97.9% |
| Immigrants | Jordan | 56.3 /100 | #166 | Average 97.9% |
| Chileans | 56.1 /100 | #167 | Average 97.9% |