Immigrants from Singapore vs Immigrants from Romania Bachelor's Degree
COMPARE
Immigrants from Singapore
Immigrants from Romania
Bachelor's Degree
Bachelor's Degree Comparison
Immigrants from Singapore
Immigrants from Romania
51.9%
BACHELOR'S DEGREE
100.0/ 100
METRIC RATING
2nd/ 347
METRIC RANK
42.9%
BACHELOR'S DEGREE
99.6/ 100
METRIC RATING
70th/ 347
METRIC RANK
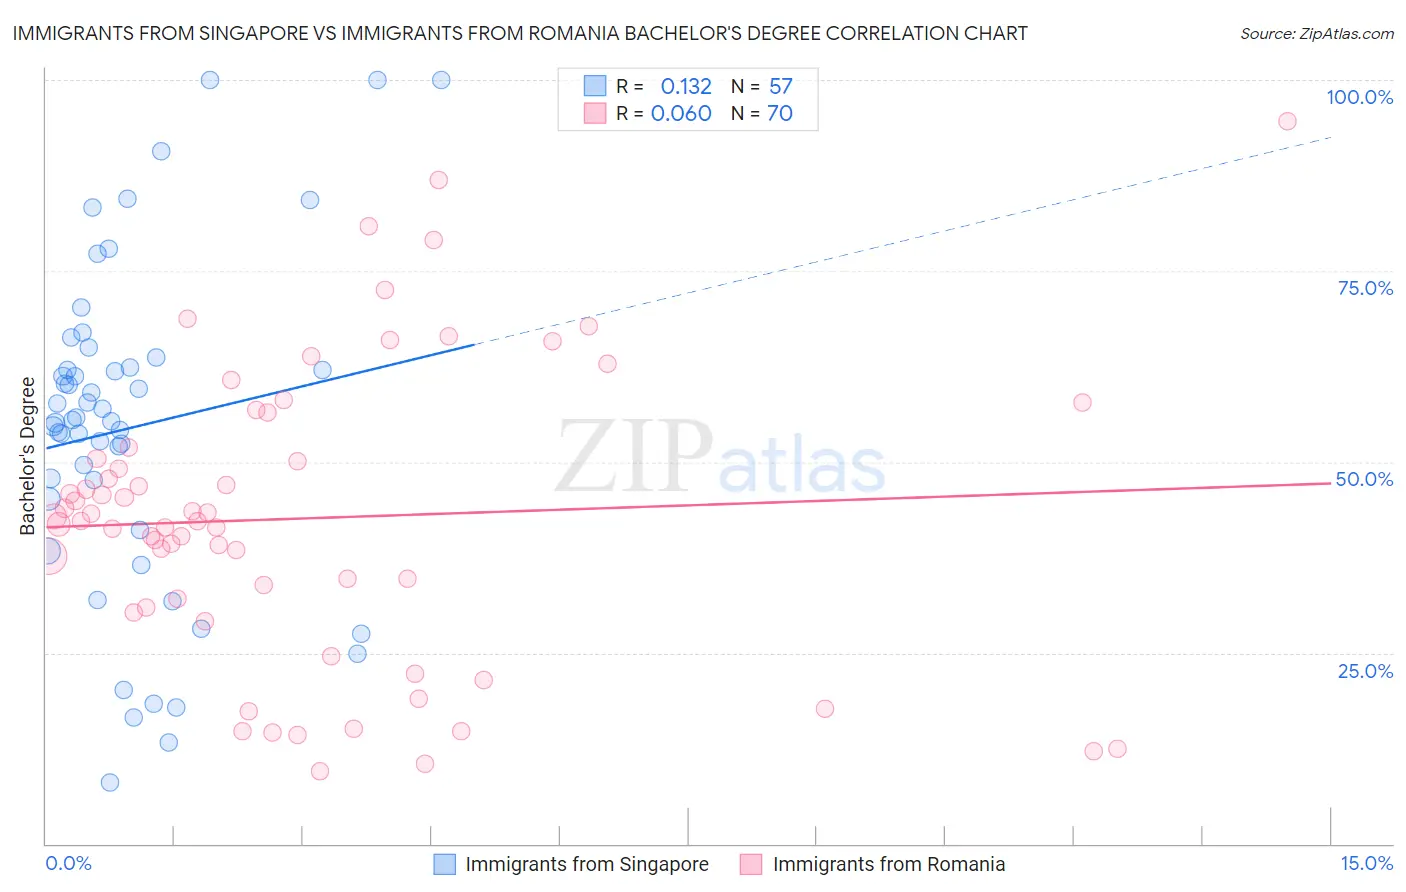
Immigrants from Singapore vs Immigrants from Romania Bachelor's Degree Correlation Chart
The statistical analysis conducted on geographies consisting of 137,512,877 people shows a poor positive correlation between the proportion of Immigrants from Singapore and percentage of population with at least bachelor's degree education in the United States with a correlation coefficient (R) of 0.132 and weighted average of 51.9%. Similarly, the statistical analysis conducted on geographies consisting of 257,014,107 people shows a slight positive correlation between the proportion of Immigrants from Romania and percentage of population with at least bachelor's degree education in the United States with a correlation coefficient (R) of 0.060 and weighted average of 42.9%, a difference of 20.9%.
Bachelor's Degree Correlation Summary
| Measurement | Immigrants from Singapore | Immigrants from Romania |
| Minimum | 8.0% | 9.6% |
| Maximum | 100.0% | 94.5% |
| Range | 92.0% | 85.0% |
| Mean | 54.5% | 42.6% |
| Median | 55.5% | 42.3% |
| Interquartile 25% (IQ1) | 43.1% | 30.9% |
| Interquartile 75% (IQ3) | 63.0% | 51.9% |
| Interquartile Range (IQR) | 20.0% | 21.0% |
| Standard Deviation (Sample) | 21.5% | 19.2% |
| Standard Deviation (Population) | 21.3% | 19.1% |
Similar Demographics by Bachelor's Degree
Demographics Similar to Immigrants from Singapore by Bachelor's Degree
In terms of bachelor's degree, the demographic groups most similar to Immigrants from Singapore are Immigrants from India (51.3%, a difference of 1.2%), Immigrants from Taiwan (51.2%, a difference of 1.4%), Filipino (52.7%, a difference of 1.5%), Iranian (51.0%, a difference of 1.9%), and Okinawan (50.5%, a difference of 2.7%).
| Demographics | Rating | Rank | Bachelor's Degree |
| Filipinos | 100.0 /100 | #1 | Exceptional 52.7% |
| Immigrants | Singapore | 100.0 /100 | #2 | Exceptional 51.9% |
| Immigrants | India | 100.0 /100 | #3 | Exceptional 51.3% |
| Immigrants | Taiwan | 100.0 /100 | #4 | Exceptional 51.2% |
| Iranians | 100.0 /100 | #5 | Exceptional 51.0% |
| Okinawans | 100.0 /100 | #6 | Exceptional 50.5% |
| Immigrants | Iran | 100.0 /100 | #7 | Exceptional 50.3% |
| Thais | 100.0 /100 | #8 | Exceptional 50.1% |
| Immigrants | Israel | 100.0 /100 | #9 | Exceptional 50.0% |
| Cypriots | 100.0 /100 | #10 | Exceptional 49.0% |
| Immigrants | Australia | 100.0 /100 | #11 | Exceptional 48.5% |
| Immigrants | China | 100.0 /100 | #12 | Exceptional 48.4% |
| Immigrants | South Central Asia | 100.0 /100 | #13 | Exceptional 48.3% |
| Immigrants | Hong Kong | 100.0 /100 | #14 | Exceptional 48.2% |
| Immigrants | Eastern Asia | 100.0 /100 | #15 | Exceptional 48.1% |
Demographics Similar to Immigrants from Romania by Bachelor's Degree
In terms of bachelor's degree, the demographic groups most similar to Immigrants from Romania are Immigrants from Argentina (42.8%, a difference of 0.26%), Ethiopian (42.8%, a difference of 0.35%), Immigrants from Uzbekistan (42.8%, a difference of 0.40%), Immigrants from Pakistan (43.1%, a difference of 0.49%), and Bhutanese (42.7%, a difference of 0.62%).
| Demographics | Rating | Rank | Bachelor's Degree |
| Immigrants | Europe | 99.8 /100 | #63 | Exceptional 43.4% |
| Argentineans | 99.7 /100 | #64 | Exceptional 43.3% |
| Zimbabweans | 99.7 /100 | #65 | Exceptional 43.3% |
| Immigrants | Netherlands | 99.7 /100 | #66 | Exceptional 43.3% |
| Egyptians | 99.7 /100 | #67 | Exceptional 43.3% |
| Immigrants | Indonesia | 99.7 /100 | #68 | Exceptional 43.3% |
| Immigrants | Pakistan | 99.7 /100 | #69 | Exceptional 43.1% |
| Immigrants | Romania | 99.6 /100 | #70 | Exceptional 42.9% |
| Immigrants | Argentina | 99.6 /100 | #71 | Exceptional 42.8% |
| Ethiopians | 99.5 /100 | #72 | Exceptional 42.8% |
| Immigrants | Uzbekistan | 99.5 /100 | #73 | Exceptional 42.8% |
| Bhutanese | 99.5 /100 | #74 | Exceptional 42.7% |
| Immigrants | Zimbabwe | 99.4 /100 | #75 | Exceptional 42.6% |
| Immigrants | Egypt | 99.4 /100 | #76 | Exceptional 42.6% |
| Immigrants | Eastern Europe | 99.4 /100 | #77 | Exceptional 42.5% |