Immigrants from Singapore vs African Bachelor's Degree
COMPARE
Immigrants from Singapore
African
Bachelor's Degree
Bachelor's Degree Comparison
Immigrants from Singapore
Africans
51.9%
BACHELOR'S DEGREE
100.0/ 100
METRIC RATING
2nd/ 347
METRIC RANK
32.9%
BACHELOR'S DEGREE
0.5/ 100
METRIC RATING
261st/ 347
METRIC RANK
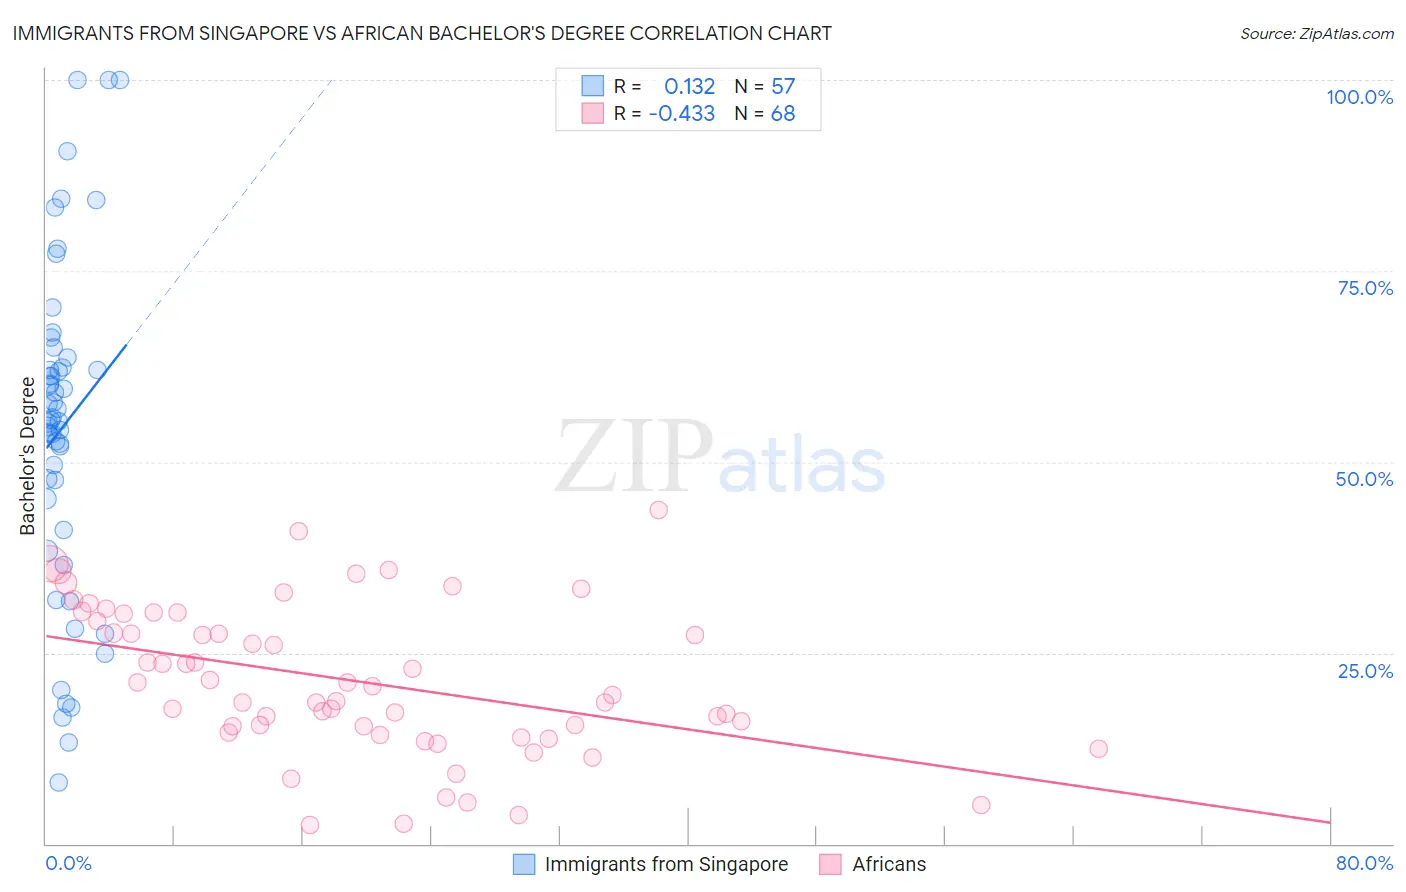
Immigrants from Singapore vs African Bachelor's Degree Correlation Chart
The statistical analysis conducted on geographies consisting of 137,512,877 people shows a poor positive correlation between the proportion of Immigrants from Singapore and percentage of population with at least bachelor's degree education in the United States with a correlation coefficient (R) of 0.132 and weighted average of 51.9%. Similarly, the statistical analysis conducted on geographies consisting of 470,032,139 people shows a moderate negative correlation between the proportion of Africans and percentage of population with at least bachelor's degree education in the United States with a correlation coefficient (R) of -0.433 and weighted average of 32.9%, a difference of 57.8%.
Bachelor's Degree Correlation Summary
| Measurement | Immigrants from Singapore | African |
| Minimum | 8.0% | 2.5% |
| Maximum | 100.0% | 43.7% |
| Range | 92.0% | 41.2% |
| Mean | 54.5% | 21.3% |
| Median | 55.5% | 20.0% |
| Interquartile 25% (IQ1) | 43.1% | 15.0% |
| Interquartile 75% (IQ3) | 63.0% | 29.7% |
| Interquartile Range (IQR) | 20.0% | 14.7% |
| Standard Deviation (Sample) | 21.5% | 9.7% |
| Standard Deviation (Population) | 21.3% | 9.6% |
Similar Demographics by Bachelor's Degree
Demographics Similar to Immigrants from Singapore by Bachelor's Degree
In terms of bachelor's degree, the demographic groups most similar to Immigrants from Singapore are Immigrants from India (51.3%, a difference of 1.2%), Immigrants from Taiwan (51.2%, a difference of 1.4%), Filipino (52.7%, a difference of 1.5%), Iranian (51.0%, a difference of 1.9%), and Okinawan (50.5%, a difference of 2.7%).
| Demographics | Rating | Rank | Bachelor's Degree |
| Filipinos | 100.0 /100 | #1 | Exceptional 52.7% |
| Immigrants | Singapore | 100.0 /100 | #2 | Exceptional 51.9% |
| Immigrants | India | 100.0 /100 | #3 | Exceptional 51.3% |
| Immigrants | Taiwan | 100.0 /100 | #4 | Exceptional 51.2% |
| Iranians | 100.0 /100 | #5 | Exceptional 51.0% |
| Okinawans | 100.0 /100 | #6 | Exceptional 50.5% |
| Immigrants | Iran | 100.0 /100 | #7 | Exceptional 50.3% |
| Thais | 100.0 /100 | #8 | Exceptional 50.1% |
| Immigrants | Israel | 100.0 /100 | #9 | Exceptional 50.0% |
| Cypriots | 100.0 /100 | #10 | Exceptional 49.0% |
| Immigrants | Australia | 100.0 /100 | #11 | Exceptional 48.5% |
| Immigrants | China | 100.0 /100 | #12 | Exceptional 48.4% |
| Immigrants | South Central Asia | 100.0 /100 | #13 | Exceptional 48.3% |
| Immigrants | Hong Kong | 100.0 /100 | #14 | Exceptional 48.2% |
| Immigrants | Eastern Asia | 100.0 /100 | #15 | Exceptional 48.1% |
Demographics Similar to Africans by Bachelor's Degree
In terms of bachelor's degree, the demographic groups most similar to Africans are Immigrants from Jamaica (32.9%, a difference of 0.0%), Malaysian (32.9%, a difference of 0.090%), Belizean (32.8%, a difference of 0.29%), Osage (33.0%, a difference of 0.45%), and French American Indian (33.1%, a difference of 0.50%).
| Demographics | Rating | Rank | Bachelor's Degree |
| Native Hawaiians | 0.7 /100 | #254 | Tragic 33.2% |
| Iroquois | 0.7 /100 | #255 | Tragic 33.2% |
| Nicaraguans | 0.6 /100 | #256 | Tragic 33.1% |
| Spanish Americans | 0.6 /100 | #257 | Tragic 33.1% |
| French American Indians | 0.6 /100 | #258 | Tragic 33.1% |
| Osage | 0.5 /100 | #259 | Tragic 33.0% |
| Malaysians | 0.5 /100 | #260 | Tragic 32.9% |
| Africans | 0.5 /100 | #261 | Tragic 32.9% |
| Immigrants | Jamaica | 0.5 /100 | #262 | Tragic 32.9% |
| Belizeans | 0.4 /100 | #263 | Tragic 32.8% |
| Central American Indians | 0.3 /100 | #264 | Tragic 32.5% |
| Bahamians | 0.3 /100 | #265 | Tragic 32.5% |
| Immigrants | Dominica | 0.3 /100 | #266 | Tragic 32.5% |
| Cubans | 0.3 /100 | #267 | Tragic 32.5% |
| Immigrants | Portugal | 0.2 /100 | #268 | Tragic 32.2% |