Belgian vs Immigrants from Eastern Europe 2nd Grade

COMPARE

Belgian
Race
Ancestry
AfghanAfricanAlaska NativeAlaskan AthabascanAlbanianAleutAlsatianAmericanApacheArabArapahoArgentineanArmenianAssyrian/Chaldean/SyriacAustralianAustrianBahamianBangladeshiBarbadianBasqueBelgianBelizeanBermudanBhutaneseBlackfeetBolivianBrazilianBritishBritish West IndianBulgarianBurmeseCajunCambodianCanadianCape VerdeanCarpatho RusynCelticCentral AmericanCentral American IndianCherokeeCheyenneChickasawChileanChineseChippewaChoctawColombianColvilleComancheCosta RicanCreeCreekCroatianCrowCubanCypriotCzechCzechoslovakianDanishDelawareDominicanDutchDutch West IndianEastern EuropeanEcuadorianEgyptianEnglishEstonianEthiopianEuropeanFijianFilipinoFinnishFrenchFrench American IndianFrench CanadianGermanGerman RussianGhanaianGreekGuamanian/ChamorroGuatemalanGuyaneseHaitianHmongHonduranHopiHoumaHungarianIcelanderIndian (Asian)IndonesianInupiatIranianIraqiIrishIroquoisIsraeliItalianJamaicanJapaneseJordanianKenyanKiowaKoreanLaotianLatvianLebaneseLiberianLithuanianLumbeeLuxembourgerMacedonianMalaysianMalteseMarshalleseMenomineeMexicanMexican American IndianMongolianMoroccanNative HawaiianNavajoNepaleseNew ZealanderNicaraguanNigerianNorthern EuropeanNorwegianOkinawanOsageOttawaPaiutePakistaniPalestinianPanamanianParaguayanPennsylvania GermanPeruvianPimaPolishPortuguesePotawatomiPuebloPuerto RicanPuget Sound SalishRomanianRussianSalvadoranSamoanScandinavianScotch-IrishScottishSeminoleSenegaleseSerbianShoshoneSierra LeoneanSiouxSlavicSlovakSloveneSomaliSouth AfricanSouth AmericanSouth American IndianSoviet UnionSpaniardSpanishSpanish AmericanSpanish American IndianSri LankanSubsaharan AfricanSudaneseSwedishSwissSyrianTaiwaneseThaiTlingit-HaidaTohono O'OdhamTonganTrinidadian and TobagonianTsimshianTurkishU.S. Virgin IslanderUgandanUkrainianUruguayanUteVenezuelanVietnameseWelshWest IndianYakamaYaquiYugoslavianYumanYup'ikZimbabwean
Immigration
NonimmigrantsImmigrantsAfghanistanAfricaAlbaniaArgentinaArmeniaAsiaAustraliaAustriaBahamasBangladeshBarbadosBelarusBelgiumBelizeBoliviaBosnia and HerzegovinaBrazilBulgariaBurma/MyanmarCabo VerdeCambodiaCameroonCanadaCaribbeanCentral AmericaChileChinaColombiaCongoCosta RicaCroatiaCubaCzechoslovakiaDenmarkDominicaDominican RepublicEastern AfricaEastern AsiaEcuadorEgyptEl SalvadorEnglandEritreaEthiopiaEuropeFijiFranceGermanyGhanaGreeceGrenadaGuatemalaGuyanaHaitiHondurasHong KongHungaryIndiaIndonesiaIranIraqIrelandIsraelItalyJamaicaJapanJordanKazakhstanKenyaKoreaKuwaitLaosLatin AmericaLatviaLebanonLiberiaLithuaniaMalaysiaMexicoMicronesiaMiddle AfricaMoldovaMoroccoNepalNetherlandsNicaraguaNigeriaNorth AmericaNorth MacedoniaNorthern AfricaNorthern EuropeNorwayOceaniaPakistanPanamaPeruPhilippinesPolandPortugalRomaniaRussiaSaudi ArabiaScotlandSenegalSerbiaSierra LeoneSingaporeSomaliaSouth AfricaSouth AmericaSouth Central AsiaSouth Eastern AsiaSouthern EuropeSpainSri LankaSt. Vincent and the GrenadinesSudanSwedenSwitzerlandSyriaTaiwanThailandTrinidad and TobagoTurkeyUgandaUkraineUruguayUzbekistanVenezuelaVietnamWest IndiesWestern AfricaWestern AsiaWestern EuropeYemenZaireZimbabweAzores
Immigrants from Eastern Europe
Race
Ancestry
AfghanAfricanAlaska NativeAlaskan AthabascanAlbanianAleutAlsatianAmericanApacheArabArapahoArgentineanArmenianAssyrian/Chaldean/SyriacAustralianAustrianBahamianBangladeshiBarbadianBasqueBelizeanBermudanBhutaneseBlackfeetBolivianBrazilianBritishBritish West IndianBulgarianBurmeseCajunCambodianCanadianCape VerdeanCarpatho RusynCelticCentral AmericanCentral American IndianCherokeeCheyenneChickasawChileanChineseChippewaChoctawColombianColvilleComancheCosta RicanCreeCreekCroatianCrowCubanCypriotCzechCzechoslovakianDanishDelawareDominicanDutchDutch West IndianEastern EuropeanEcuadorianEgyptianEnglishEstonianEthiopianEuropeanFijianFilipinoFinnishFrenchFrench American IndianFrench CanadianGermanGerman RussianGhanaianGreekGuamanian/ChamorroGuatemalanGuyaneseHaitianHmongHonduranHopiHoumaHungarianIcelanderIndian (Asian)IndonesianInupiatIranianIraqiIrishIroquoisIsraeliItalianJamaicanJapaneseJordanianKenyanKiowaKoreanLaotianLatvianLebaneseLiberianLithuanianLumbeeLuxembourgerMacedonianMalaysianMalteseMarshalleseMenomineeMexicanMexican American IndianMongolianMoroccanNative HawaiianNavajoNepaleseNew ZealanderNicaraguanNigerianNorthern EuropeanNorwegianOkinawanOsageOttawaPaiutePakistaniPalestinianPanamanianParaguayanPennsylvania GermanPeruvianPimaPolishPortuguesePotawatomiPuebloPuerto RicanPuget Sound SalishRomanianRussianSalvadoranSamoanScandinavianScotch-IrishScottishSeminoleSenegaleseSerbianShoshoneSierra LeoneanSiouxSlavicSlovakSloveneSomaliSouth AfricanSouth AmericanSouth American IndianSoviet UnionSpaniardSpanishSpanish AmericanSpanish American IndianSri LankanSubsaharan AfricanSudaneseSwedishSwissSyrianTaiwaneseThaiTlingit-HaidaTohono O'OdhamTonganTrinidadian and TobagonianTsimshianTurkishU.S. Virgin IslanderUgandanUkrainianUruguayanUteVenezuelanVietnameseWelshWest IndianYakamaYaquiYugoslavianYumanYup'ikZimbabwean
Immigration
NonimmigrantsImmigrantsAfghanistanAfricaAlbaniaArgentinaArmeniaAsiaAustraliaAustriaBahamasBangladeshBarbadosBelarusBelgiumBelizeBoliviaBosnia and HerzegovinaBrazilBulgariaBurma/MyanmarCabo VerdeCambodiaCameroonCanadaCaribbeanCentral AmericaChileChinaColombiaCongoCosta RicaCroatiaCubaCzechoslovakiaDenmarkDominicaDominican RepublicEastern AfricaEastern AsiaEastern EuropeEcuadorEgyptEl SalvadorEnglandEritreaEthiopiaEuropeFijiFranceGermanyGhanaGreeceGrenadaGuatemalaGuyanaHaitiHondurasHong KongHungaryIndiaIndonesiaIranIraqIrelandIsraelItalyJamaicaJapanJordanKazakhstanKenyaKoreaKuwaitLaosLatin AmericaLatviaLebanonLiberiaLithuaniaMalaysiaMexicoMicronesiaMiddle AfricaMoldovaMoroccoNepalNetherlandsNicaraguaNigeriaNorth AmericaNorth MacedoniaNorthern AfricaNorthern EuropeNorwayOceaniaPakistanPanamaPeruPhilippinesPolandPortugalRomaniaRussiaSaudi ArabiaScotlandSenegalSerbiaSierra LeoneSingaporeSomaliaSouth AfricaSouth AmericaSouth Central AsiaSouth Eastern AsiaSouthern EuropeSpainSri LankaSt. Vincent and the GrenadinesSudanSwedenSwitzerlandSyriaTaiwanThailandTrinidad and TobagoTurkeyUgandaUkraineUruguayUzbekistanVenezuelaVietnamWest IndiesWestern AfricaWestern AsiaWestern EuropeYemenZaireZimbabweAzores
2nd Grade
Income
Poverty
Unemployment
Labor Participation
Family Structure
Vehicle Availability
Education Level
Disability

2nd Grade Comparison

Belgians

Immigrants from Eastern Europe

Exceptional
Good
98.4%
2ND GRADE
99.9/ 100
METRIC RATING
43rd/ 347
METRIC RANK
97.9%
2ND GRADE
61.1/ 100
METRIC RATING
160th/ 347
METRIC RANK

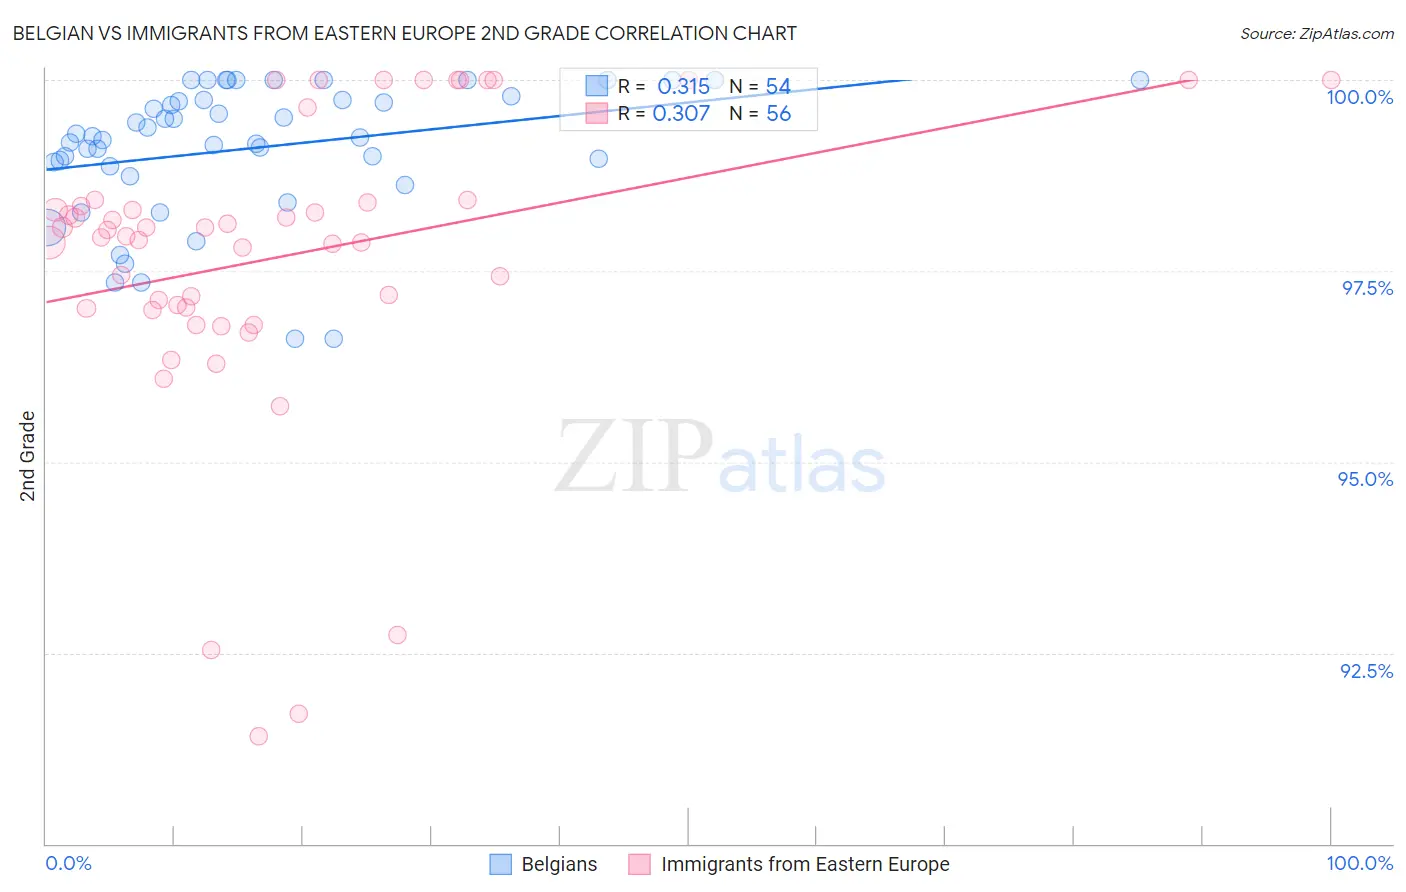
Belgian vs Immigrants from Eastern Europe 2nd Grade Correlation Chart

The statistical analysis conducted on geographies consisting of 356,016,627 people shows a mild positive correlation between the proportion of Belgians and percentage of population with at least 2nd grade education in the United States with a correlation coefficient (R) of 0.315 and weighted average of 98.4%. Similarly, the statistical analysis conducted on geographies consisting of 475,879,420 people shows a mild positive correlation between the proportion of Immigrants from Eastern Europe and percentage of population with at least 2nd grade education in the United States with a correlation coefficient (R) of 0.307 and weighted average of 97.9%, a difference of 0.52%.
Belgian vs Immigrants from Eastern Europe 2nd Grade

2nd Grade Correlation Summary

MeasurementBelgianImmigrants from Eastern Europe
Minimum96.6%91.4%
Maximum100.0%100.0%
Range3.4%8.6%
Mean99.1%97.7%
Median99.3%98.0%
Interquartile 25% (IQ1)98.9%97.0%
Interquartile 75% (IQ3)99.7%98.4%
Interquartile Range (IQR)0.87%1.4%
Standard Deviation (Sample)0.88%2.0%
Standard Deviation (Population)0.87%1.9%

Similar Demographics by 2nd Grade

Demographics Similar to Belgians by 2nd Grade

In terms of 2nd grade, the demographic groups most similar to Belgians are Native Hawaiian (98.4%, a difference of 0.0%), Northern European (98.4%, a difference of 0.0%), Eastern European (98.4%, a difference of 0.010%), Latvian (98.4%, a difference of 0.020%), and Chippewa (98.4%, a difference of 0.020%).
DemographicsRating | Rank2nd Grade
British
100.0
/100
|
#36
Exceptional
98.5%
Italians
99.9
/100
|
#37
Exceptional
98.4%
Latvians
99.9
/100
|
#38
Exceptional
98.4%
Chippewa
99.9
/100
|
#39
Exceptional
98.4%
Luxembourgers
99.9
/100
|
#40
Exceptional
98.4%
Eastern Europeans
99.9
/100
|
#41
Exceptional
98.4%
Native Hawaiians
99.9
/100
|
#42
Exceptional
98.4%
Belgians
99.9
/100
|
#43
Exceptional
98.4%
Northern Europeans
99.9
/100
|
#44
Exceptional
98.4%
Hungarians
99.9
/100
|
#45
Exceptional
98.4%
Lumbee
99.9
/100
|
#46
Exceptional
98.4%
Ottawa
99.9
/100
|
#47
Exceptional
98.4%
Czechoslovakians
99.9
/100
|
#48
Exceptional
98.4%
Celtics
99.8
/100
|
#49
Exceptional
98.4%
Whites/Caucasians
99.8
/100
|
#50
Exceptional
98.4%

Demographics Similar to Immigrants from Eastern Europe by 2nd Grade

In terms of 2nd grade, the demographic groups most similar to Immigrants from Eastern Europe are Immigrants from Russia (97.9%, a difference of 0.0%), Immigrants from Italy (97.9%, a difference of 0.0%), French American Indian (97.9%, a difference of 0.010%), Dutch West Indian (97.9%, a difference of 0.010%), and Venezuelan (97.9%, a difference of 0.010%).
DemographicsRating | Rank2nd Grade
Immigrants | South Central Asia
68.3
/100
|
#153
Good
97.9%
Marshallese
67.7
/100
|
#154
Good
97.9%
French American Indians
64.3
/100
|
#155
Good
97.9%
Dutch West Indians
63.8
/100
|
#156
Good
97.9%
Venezuelans
63.3
/100
|
#157
Good
97.9%
Immigrants | Iran
62.8
/100
|
#158
Good
97.9%
Comanche
62.8
/100
|
#159
Good
97.9%
Immigrants | Eastern Europe
61.1
/100
|
#160
Good
97.9%
Immigrants | Russia
60.3
/100
|
#161
Good
97.9%
Immigrants | Italy
60.2
/100
|
#162
Good
97.9%
Bermudans
59.4
/100
|
#163
Average
97.9%
Ugandans
56.6
/100
|
#164
Average
97.9%
Spanish Americans
56.4
/100
|
#165
Average
97.9%
Immigrants | Jordan
56.3
/100
|
#166
Average
97.9%
Chileans
56.1
/100
|
#167
Average
97.9%