Immigrants from Singapore vs Guamanian/Chamorro 4th Grade
COMPARE
Immigrants from Singapore
Guamanian/Chamorro
4th Grade
4th Grade Comparison
Immigrants from Singapore
Guamanians/Chamorros
97.9%
4TH GRADE
97.3/ 100
METRIC RATING
108th/ 347
METRIC RANK
97.4%
4TH GRADE
23.0/ 100
METRIC RATING
198th/ 347
METRIC RANK
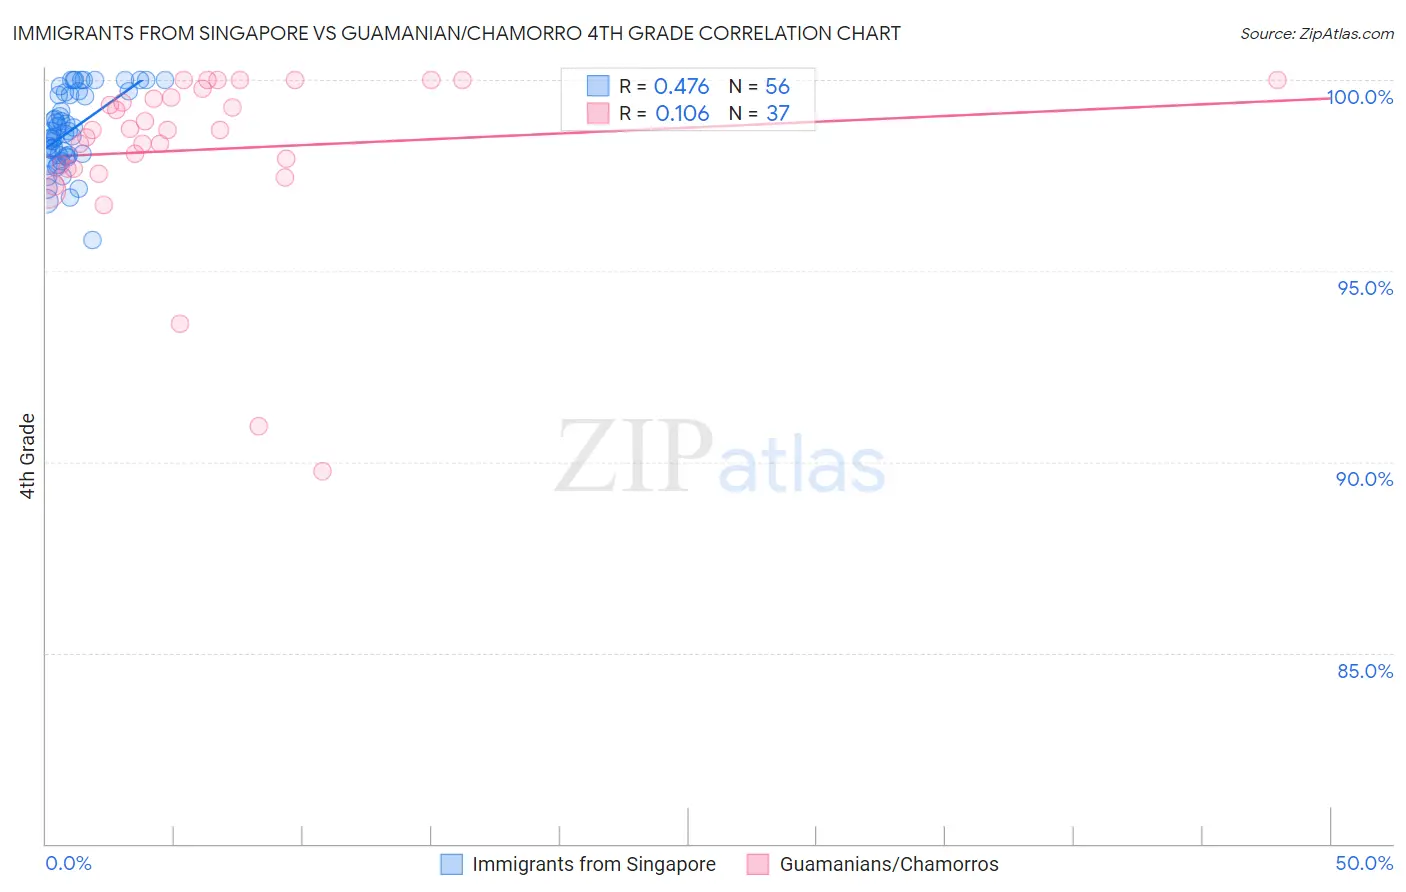
Immigrants from Singapore vs Guamanian/Chamorro 4th Grade Correlation Chart
The statistical analysis conducted on geographies consisting of 137,521,094 people shows a moderate positive correlation between the proportion of Immigrants from Singapore and percentage of population with at least 4th grade education in the United States with a correlation coefficient (R) of 0.476 and weighted average of 97.9%. Similarly, the statistical analysis conducted on geographies consisting of 221,965,618 people shows a poor positive correlation between the proportion of Guamanians/Chamorros and percentage of population with at least 4th grade education in the United States with a correlation coefficient (R) of 0.106 and weighted average of 97.4%, a difference of 0.45%.
4th Grade Correlation Summary
| Measurement | Immigrants from Singapore | Guamanian/Chamorro |
| Minimum | 95.8% | 89.7% |
| Maximum | 100.0% | 100.0% |
| Range | 4.2% | 10.3% |
| Mean | 98.7% | 98.2% |
| Median | 98.6% | 98.7% |
| Interquartile 25% (IQ1) | 98.0% | 97.7% |
| Interquartile 75% (IQ3) | 99.6% | 99.6% |
| Interquartile Range (IQR) | 1.6% | 2.0% |
| Standard Deviation (Sample) | 0.99% | 2.3% |
| Standard Deviation (Population) | 0.99% | 2.3% |
Similar Demographics by 4th Grade
Demographics Similar to Immigrants from Singapore by 4th Grade
In terms of 4th grade, the demographic groups most similar to Immigrants from Singapore are Bhutanese (97.9%, a difference of 0.0%), Puget Sound Salish (97.9%, a difference of 0.010%), Nonimmigrants (97.9%, a difference of 0.010%), German Russian (97.9%, a difference of 0.010%), and Immigrants from Czechoslovakia (97.9%, a difference of 0.010%).
| Demographics | Rating | Rank | 4th Grade |
| Cree | 98.1 /100 | #101 | Exceptional 97.9% |
| Choctaw | 97.9 /100 | #102 | Exceptional 97.9% |
| Puget Sound Salish | 97.7 /100 | #103 | Exceptional 97.9% |
| Immigrants | Nonimmigrants | 97.5 /100 | #104 | Exceptional 97.9% |
| German Russians | 97.5 /100 | #105 | Exceptional 97.9% |
| Immigrants | Czechoslovakia | 97.5 /100 | #106 | Exceptional 97.9% |
| Bhutanese | 97.4 /100 | #107 | Exceptional 97.9% |
| Immigrants | Singapore | 97.3 /100 | #108 | Exceptional 97.9% |
| Immigrants | Latvia | 96.8 /100 | #109 | Exceptional 97.8% |
| Thais | 96.7 /100 | #110 | Exceptional 97.8% |
| Immigrants | Switzerland | 96.1 /100 | #111 | Exceptional 97.8% |
| Okinawans | 96.0 /100 | #112 | Exceptional 97.8% |
| Basques | 95.8 /100 | #113 | Exceptional 97.8% |
| Iroquois | 95.4 /100 | #114 | Exceptional 97.8% |
| Lebanese | 95.4 /100 | #115 | Exceptional 97.8% |
Demographics Similar to Guamanians/Chamorros by 4th Grade
In terms of 4th grade, the demographic groups most similar to Guamanians/Chamorros are Hawaiian (97.4%, a difference of 0.010%), Native/Alaskan (97.4%, a difference of 0.010%), Immigrants from Albania (97.4%, a difference of 0.020%), Immigrants from Uganda (97.4%, a difference of 0.020%), and Immigrants from Ukraine (97.4%, a difference of 0.030%).
| Demographics | Rating | Rank | 4th Grade |
| Navajo | 30.7 /100 | #191 | Fair 97.4% |
| Immigrants | Ukraine | 30.1 /100 | #192 | Fair 97.4% |
| Immigrants | Egypt | 30.1 /100 | #193 | Fair 97.4% |
| Portuguese | 29.2 /100 | #194 | Fair 97.4% |
| Paraguayans | 28.9 /100 | #195 | Fair 97.4% |
| Immigrants | Albania | 27.7 /100 | #196 | Fair 97.4% |
| Hawaiians | 25.6 /100 | #197 | Fair 97.4% |
| Guamanians/Chamorros | 23.0 /100 | #198 | Fair 97.4% |
| Natives/Alaskans | 20.6 /100 | #199 | Fair 97.4% |
| Immigrants | Uganda | 19.8 /100 | #200 | Poor 97.4% |
| Immigrants | Southern Europe | 16.2 /100 | #201 | Poor 97.4% |
| Immigrants | Chile | 16.1 /100 | #202 | Poor 97.4% |
| Immigrants | Northern Africa | 15.1 /100 | #203 | Poor 97.4% |
| Africans | 14.6 /100 | #204 | Poor 97.4% |
| Paiute | 13.2 /100 | #205 | Poor 97.3% |