Immigrants from Sierra Leone vs Polish 5th Grade
COMPARE
Immigrants from Sierra Leone
Polish
5th Grade
5th Grade Comparison
Immigrants from Sierra Leone
Poles
96.8%
5TH GRADE
0.4/ 100
METRIC RATING
261st/ 347
METRIC RANK
98.3%
5TH GRADE
100.0/ 100
METRIC RATING
16th/ 347
METRIC RANK
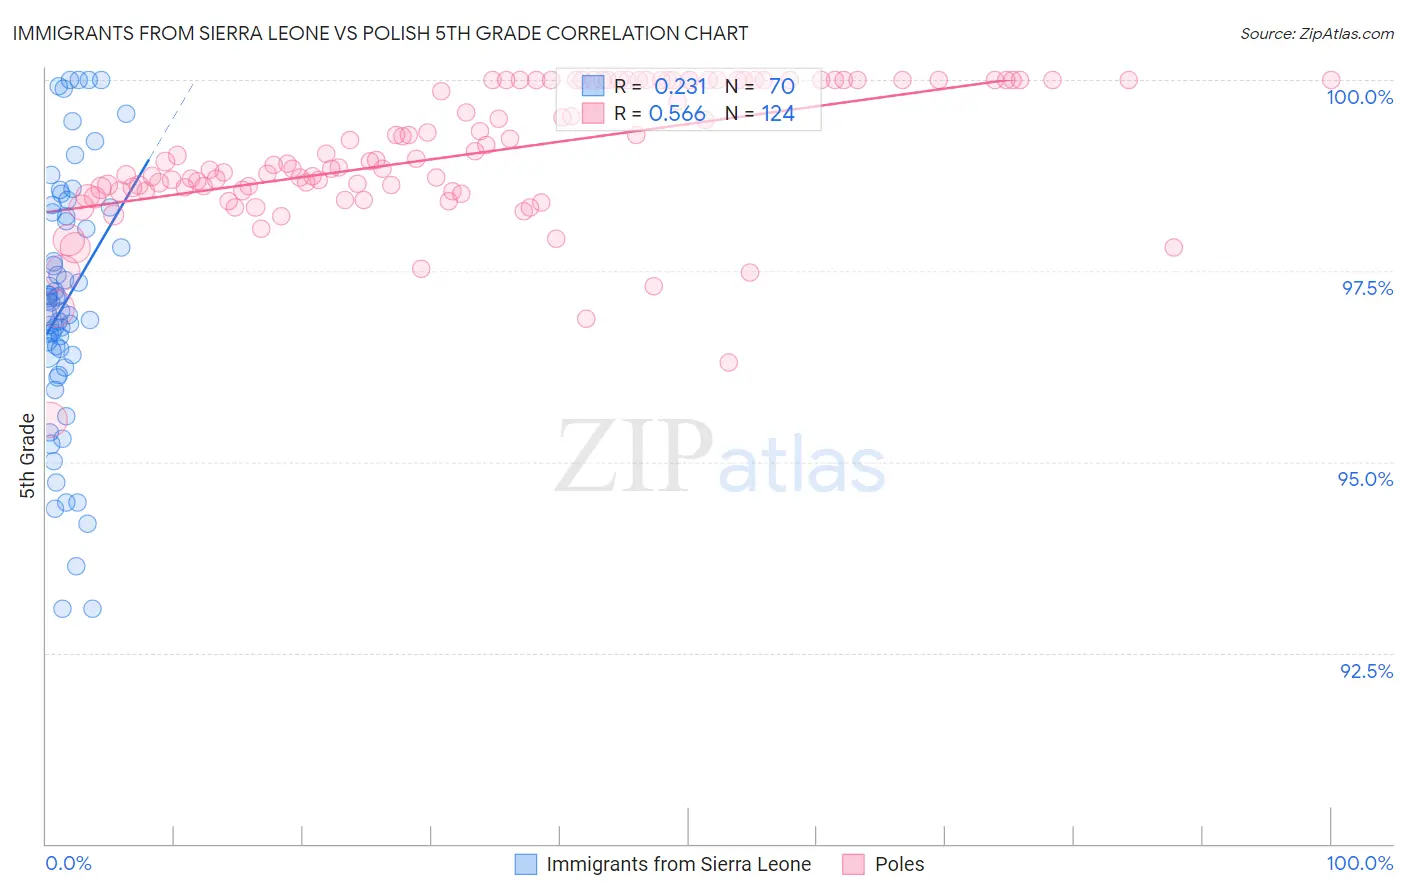
Immigrants from Sierra Leone vs Polish 5th Grade Correlation Chart
The statistical analysis conducted on geographies consisting of 101,634,956 people shows a weak positive correlation between the proportion of Immigrants from Sierra Leone and percentage of population with at least 5th grade education in the United States with a correlation coefficient (R) of 0.231 and weighted average of 96.8%. Similarly, the statistical analysis conducted on geographies consisting of 560,594,514 people shows a substantial positive correlation between the proportion of Poles and percentage of population with at least 5th grade education in the United States with a correlation coefficient (R) of 0.566 and weighted average of 98.3%, a difference of 1.5%.
5th Grade Correlation Summary
| Measurement | Immigrants from Sierra Leone | Polish |
| Minimum | 93.1% | 95.6% |
| Maximum | 100.0% | 100.0% |
| Range | 6.9% | 4.4% |
| Mean | 97.1% | 99.0% |
| Median | 97.1% | 98.9% |
| Interquartile 25% (IQ1) | 96.4% | 98.6% |
| Interquartile 75% (IQ3) | 98.3% | 100.0% |
| Interquartile Range (IQR) | 1.9% | 1.4% |
| Standard Deviation (Sample) | 1.7% | 0.88% |
| Standard Deviation (Population) | 1.7% | 0.88% |
Similar Demographics by 5th Grade
Demographics Similar to Immigrants from Sierra Leone by 5th Grade
In terms of 5th grade, the demographic groups most similar to Immigrants from Sierra Leone are Immigrants from Jamaica (96.8%, a difference of 0.0%), Immigrants from Colombia (96.8%, a difference of 0.0%), Immigrants from Uzbekistan (96.8%, a difference of 0.010%), Immigrants from Ethiopia (96.8%, a difference of 0.020%), and Immigrants from China (96.8%, a difference of 0.020%).
| Demographics | Rating | Rank | 5th Grade |
| Immigrants | Senegal | 0.8 /100 | #254 | Tragic 96.8% |
| South Americans | 0.7 /100 | #255 | Tragic 96.8% |
| Immigrants | Congo | 0.7 /100 | #256 | Tragic 96.8% |
| Peruvians | 0.6 /100 | #257 | Tragic 96.8% |
| Immigrants | Ethiopia | 0.5 /100 | #258 | Tragic 96.8% |
| Immigrants | China | 0.5 /100 | #259 | Tragic 96.8% |
| Immigrants | Jamaica | 0.4 /100 | #260 | Tragic 96.8% |
| Immigrants | Sierra Leone | 0.4 /100 | #261 | Tragic 96.8% |
| Immigrants | Colombia | 0.4 /100 | #262 | Tragic 96.8% |
| Immigrants | Uzbekistan | 0.3 /100 | #263 | Tragic 96.8% |
| West Indians | 0.3 /100 | #264 | Tragic 96.8% |
| Taiwanese | 0.3 /100 | #265 | Tragic 96.7% |
| Immigrants | Nigeria | 0.3 /100 | #266 | Tragic 96.7% |
| Immigrants | South America | 0.3 /100 | #267 | Tragic 96.7% |
| Armenians | 0.3 /100 | #268 | Tragic 96.7% |
Demographics Similar to Poles by 5th Grade
In terms of 5th grade, the demographic groups most similar to Poles are Dutch (98.3%, a difference of 0.010%), Scottish (98.3%, a difference of 0.010%), Irish (98.3%, a difference of 0.010%), Pennsylvania German (98.3%, a difference of 0.010%), and Finnish (98.2%, a difference of 0.020%).
| Demographics | Rating | Rank | 5th Grade |
| Swedes | 100.0 /100 | #9 | Exceptional 98.3% |
| English | 100.0 /100 | #10 | Exceptional 98.3% |
| Alaskan Athabascans | 100.0 /100 | #11 | Exceptional 98.3% |
| Carpatho Rusyns | 100.0 /100 | #12 | Exceptional 98.3% |
| Tlingit-Haida | 100.0 /100 | #13 | Exceptional 98.3% |
| Dutch | 100.0 /100 | #14 | Exceptional 98.3% |
| Scottish | 100.0 /100 | #15 | Exceptional 98.3% |
| Poles | 100.0 /100 | #16 | Exceptional 98.3% |
| Irish | 100.0 /100 | #17 | Exceptional 98.3% |
| Pennsylvania Germans | 100.0 /100 | #18 | Exceptional 98.3% |
| Finns | 100.0 /100 | #19 | Exceptional 98.2% |
| Lithuanians | 100.0 /100 | #20 | Exceptional 98.2% |
| Danes | 100.0 /100 | #21 | Exceptional 98.2% |
| Croatians | 100.0 /100 | #22 | Exceptional 98.2% |
| Sioux | 100.0 /100 | #23 | Exceptional 98.2% |