Immigrants from France vs Polish 5th Grade
COMPARE
Immigrants from France
Polish
5th Grade
5th Grade Comparison
Immigrants from France
Poles
97.6%
5TH GRADE
94.8/ 100
METRIC RATING
121st/ 347
METRIC RANK
98.3%
5TH GRADE
100.0/ 100
METRIC RATING
16th/ 347
METRIC RANK
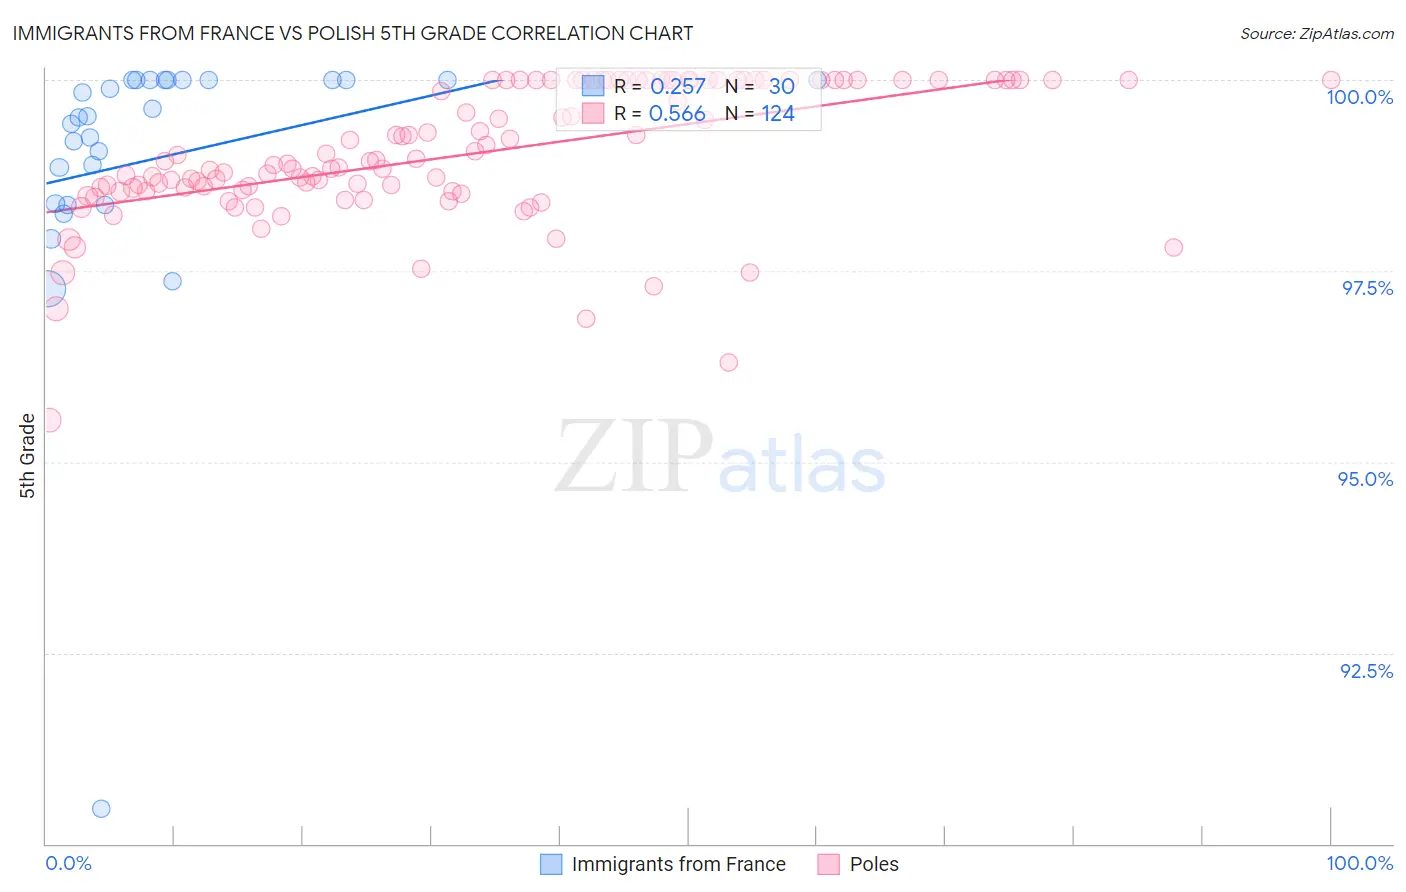
Immigrants from France vs Polish 5th Grade Correlation Chart
The statistical analysis conducted on geographies consisting of 287,920,814 people shows a weak positive correlation between the proportion of Immigrants from France and percentage of population with at least 5th grade education in the United States with a correlation coefficient (R) of 0.257 and weighted average of 97.6%. Similarly, the statistical analysis conducted on geographies consisting of 560,594,514 people shows a substantial positive correlation between the proportion of Poles and percentage of population with at least 5th grade education in the United States with a correlation coefficient (R) of 0.566 and weighted average of 98.3%, a difference of 0.65%.
5th Grade Correlation Summary
| Measurement | Immigrants from France | Polish |
| Minimum | 90.5% | 95.6% |
| Maximum | 100.0% | 100.0% |
| Range | 9.5% | 4.4% |
| Mean | 99.0% | 99.0% |
| Median | 99.5% | 98.9% |
| Interquartile 25% (IQ1) | 98.4% | 98.6% |
| Interquartile 75% (IQ3) | 100.0% | 100.0% |
| Interquartile Range (IQR) | 1.6% | 1.4% |
| Standard Deviation (Sample) | 1.8% | 0.88% |
| Standard Deviation (Population) | 1.8% | 0.88% |
Similar Demographics by 5th Grade
Demographics Similar to Immigrants from France by 5th Grade
In terms of 5th grade, the demographic groups most similar to Immigrants from France are Immigrants from Zimbabwe (97.6%, a difference of 0.0%), Immigrants from Japan (97.6%, a difference of 0.0%), Immigrants from Norway (97.6%, a difference of 0.0%), Immigrants from Saudi Arabia (97.6%, a difference of 0.010%), and Basque (97.6%, a difference of 0.010%).
| Demographics | Rating | Rank | 5th Grade |
| Lebanese | 95.7 /100 | #114 | Exceptional 97.6% |
| Okinawans | 95.7 /100 | #115 | Exceptional 97.6% |
| Immigrants | Croatia | 95.5 /100 | #116 | Exceptional 97.6% |
| Immigrants | Saudi Arabia | 95.4 /100 | #117 | Exceptional 97.6% |
| Basques | 95.2 /100 | #118 | Exceptional 97.6% |
| Syrians | 95.1 /100 | #119 | Exceptional 97.6% |
| Immigrants | Zimbabwe | 94.9 /100 | #120 | Exceptional 97.6% |
| Immigrants | France | 94.8 /100 | #121 | Exceptional 97.6% |
| Immigrants | Japan | 94.7 /100 | #122 | Exceptional 97.6% |
| Immigrants | Norway | 94.6 /100 | #123 | Exceptional 97.6% |
| Spanish | 93.7 /100 | #124 | Exceptional 97.6% |
| Immigrants | Bulgaria | 93.1 /100 | #125 | Exceptional 97.6% |
| Hmong | 92.3 /100 | #126 | Exceptional 97.6% |
| Immigrants | Serbia | 92.3 /100 | #127 | Exceptional 97.6% |
| Colville | 92.0 /100 | #128 | Exceptional 97.6% |
Demographics Similar to Poles by 5th Grade
In terms of 5th grade, the demographic groups most similar to Poles are Dutch (98.3%, a difference of 0.010%), Scottish (98.3%, a difference of 0.010%), Irish (98.3%, a difference of 0.010%), Pennsylvania German (98.3%, a difference of 0.010%), and Finnish (98.2%, a difference of 0.020%).
| Demographics | Rating | Rank | 5th Grade |
| Swedes | 100.0 /100 | #9 | Exceptional 98.3% |
| English | 100.0 /100 | #10 | Exceptional 98.3% |
| Alaskan Athabascans | 100.0 /100 | #11 | Exceptional 98.3% |
| Carpatho Rusyns | 100.0 /100 | #12 | Exceptional 98.3% |
| Tlingit-Haida | 100.0 /100 | #13 | Exceptional 98.3% |
| Dutch | 100.0 /100 | #14 | Exceptional 98.3% |
| Scottish | 100.0 /100 | #15 | Exceptional 98.3% |
| Poles | 100.0 /100 | #16 | Exceptional 98.3% |
| Irish | 100.0 /100 | #17 | Exceptional 98.3% |
| Pennsylvania Germans | 100.0 /100 | #18 | Exceptional 98.3% |
| Finns | 100.0 /100 | #19 | Exceptional 98.2% |
| Lithuanians | 100.0 /100 | #20 | Exceptional 98.2% |
| Danes | 100.0 /100 | #21 | Exceptional 98.2% |
| Croatians | 100.0 /100 | #22 | Exceptional 98.2% |
| Sioux | 100.0 /100 | #23 | Exceptional 98.2% |