Immigrants from Sierra Leone vs Cape Verdean 5th Grade
COMPARE
Immigrants from Sierra Leone
Cape Verdean
5th Grade
5th Grade Comparison
Immigrants from Sierra Leone
Cape Verdeans
96.8%
5TH GRADE
0.4/ 100
METRIC RATING
261st/ 347
METRIC RANK
95.5%
5TH GRADE
0.0/ 100
METRIC RATING
328th/ 347
METRIC RANK
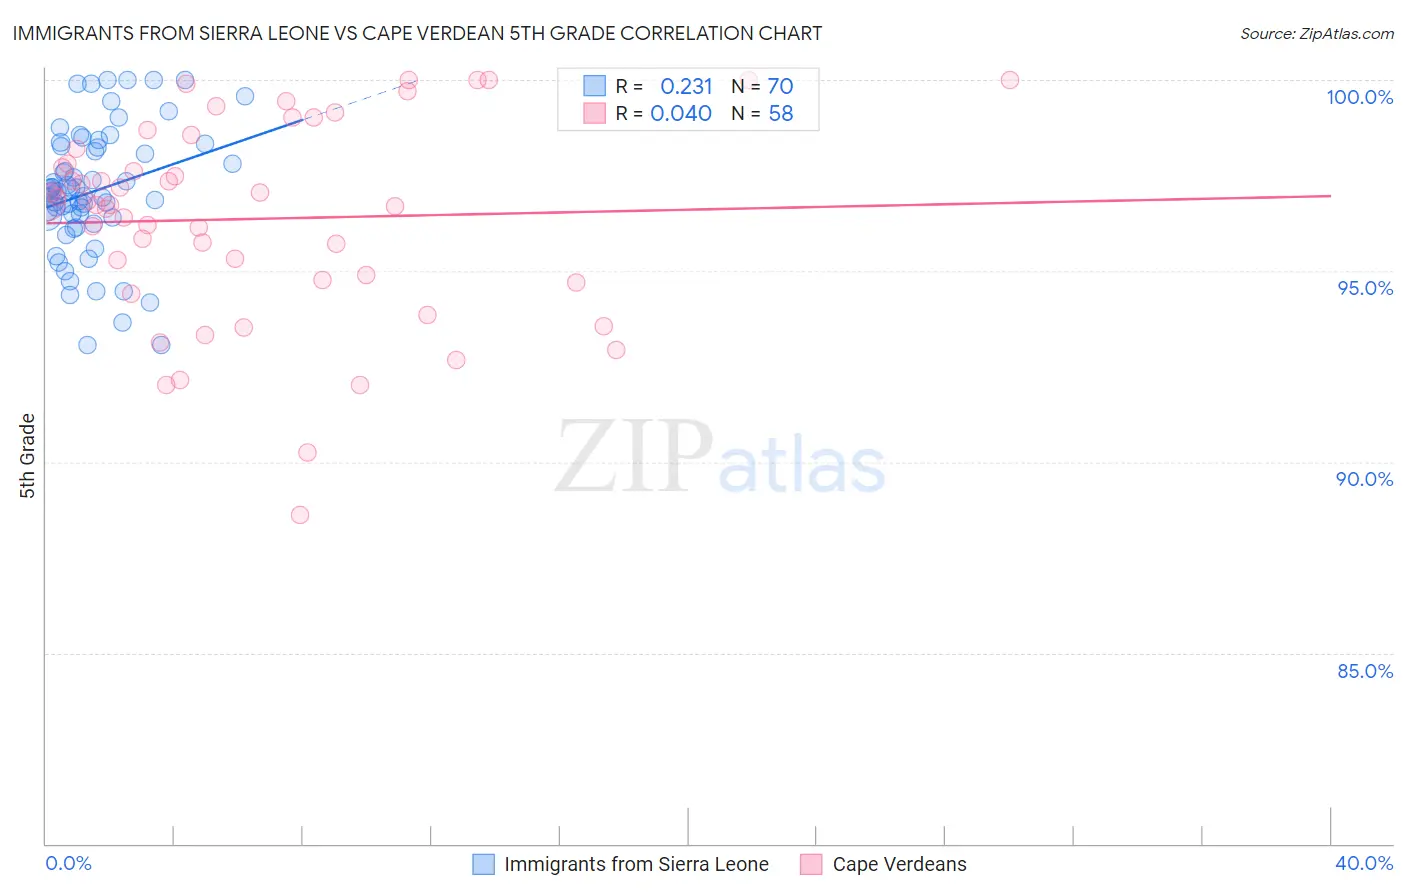
Immigrants from Sierra Leone vs Cape Verdean 5th Grade Correlation Chart
The statistical analysis conducted on geographies consisting of 101,634,956 people shows a weak positive correlation between the proportion of Immigrants from Sierra Leone and percentage of population with at least 5th grade education in the United States with a correlation coefficient (R) of 0.231 and weighted average of 96.8%. Similarly, the statistical analysis conducted on geographies consisting of 107,537,955 people shows no correlation between the proportion of Cape Verdeans and percentage of population with at least 5th grade education in the United States with a correlation coefficient (R) of 0.040 and weighted average of 95.5%, a difference of 1.3%.
5th Grade Correlation Summary
| Measurement | Immigrants from Sierra Leone | Cape Verdean |
| Minimum | 93.1% | 88.6% |
| Maximum | 100.0% | 100.0% |
| Range | 6.9% | 11.4% |
| Mean | 97.1% | 96.4% |
| Median | 97.1% | 96.8% |
| Interquartile 25% (IQ1) | 96.4% | 94.8% |
| Interquartile 75% (IQ3) | 98.3% | 98.2% |
| Interquartile Range (IQR) | 1.9% | 3.4% |
| Standard Deviation (Sample) | 1.7% | 2.6% |
| Standard Deviation (Population) | 1.7% | 2.6% |
Similar Demographics by 5th Grade
Demographics Similar to Immigrants from Sierra Leone by 5th Grade
In terms of 5th grade, the demographic groups most similar to Immigrants from Sierra Leone are Immigrants from Jamaica (96.8%, a difference of 0.0%), Immigrants from Colombia (96.8%, a difference of 0.0%), Immigrants from Uzbekistan (96.8%, a difference of 0.010%), Immigrants from Ethiopia (96.8%, a difference of 0.020%), and Immigrants from China (96.8%, a difference of 0.020%).
| Demographics | Rating | Rank | 5th Grade |
| Immigrants | Senegal | 0.8 /100 | #254 | Tragic 96.8% |
| South Americans | 0.7 /100 | #255 | Tragic 96.8% |
| Immigrants | Congo | 0.7 /100 | #256 | Tragic 96.8% |
| Peruvians | 0.6 /100 | #257 | Tragic 96.8% |
| Immigrants | Ethiopia | 0.5 /100 | #258 | Tragic 96.8% |
| Immigrants | China | 0.5 /100 | #259 | Tragic 96.8% |
| Immigrants | Jamaica | 0.4 /100 | #260 | Tragic 96.8% |
| Immigrants | Sierra Leone | 0.4 /100 | #261 | Tragic 96.8% |
| Immigrants | Colombia | 0.4 /100 | #262 | Tragic 96.8% |
| Immigrants | Uzbekistan | 0.3 /100 | #263 | Tragic 96.8% |
| West Indians | 0.3 /100 | #264 | Tragic 96.8% |
| Taiwanese | 0.3 /100 | #265 | Tragic 96.7% |
| Immigrants | Nigeria | 0.3 /100 | #266 | Tragic 96.7% |
| Immigrants | South America | 0.3 /100 | #267 | Tragic 96.7% |
| Armenians | 0.3 /100 | #268 | Tragic 96.7% |
Demographics Similar to Cape Verdeans by 5th Grade
In terms of 5th grade, the demographic groups most similar to Cape Verdeans are Mexican American Indian (95.5%, a difference of 0.010%), Immigrants from Cambodia (95.5%, a difference of 0.030%), Dominican (95.5%, a difference of 0.030%), Hispanic or Latino (95.6%, a difference of 0.060%), and Honduran (95.6%, a difference of 0.070%).
| Demographics | Rating | Rank | 5th Grade |
| Immigrants | Belize | 0.0 /100 | #321 | Tragic 95.7% |
| Immigrants | Nicaragua | 0.0 /100 | #322 | Tragic 95.6% |
| Immigrants | Fiji | 0.0 /100 | #323 | Tragic 95.6% |
| Hondurans | 0.0 /100 | #324 | Tragic 95.6% |
| Hispanics or Latinos | 0.0 /100 | #325 | Tragic 95.6% |
| Immigrants | Cambodia | 0.0 /100 | #326 | Tragic 95.5% |
| Dominicans | 0.0 /100 | #327 | Tragic 95.5% |
| Cape Verdeans | 0.0 /100 | #328 | Tragic 95.5% |
| Mexican American Indians | 0.0 /100 | #329 | Tragic 95.5% |
| Immigrants | Armenia | 0.0 /100 | #330 | Tragic 95.4% |
| Immigrants | Honduras | 0.0 /100 | #331 | Tragic 95.4% |
| Immigrants | Dominican Republic | 0.0 /100 | #332 | Tragic 95.3% |
| Immigrants | Latin America | 0.0 /100 | #333 | Tragic 95.3% |
| Nepalese | 0.0 /100 | #334 | Tragic 95.2% |
| Mexicans | 0.0 /100 | #335 | Tragic 95.2% |