Immigrants from Serbia vs Cambodian High School Diploma
COMPARE
Immigrants from Serbia
Cambodian
High School Diploma
High School Diploma Comparison
Immigrants from Serbia
Cambodians
90.5%
HIGH SCHOOL DIPLOMA
98.4/ 100
METRIC RATING
96th/ 347
METRIC RANK
90.8%
HIGH SCHOOL DIPLOMA
99.4/ 100
METRIC RATING
75th/ 347
METRIC RANK
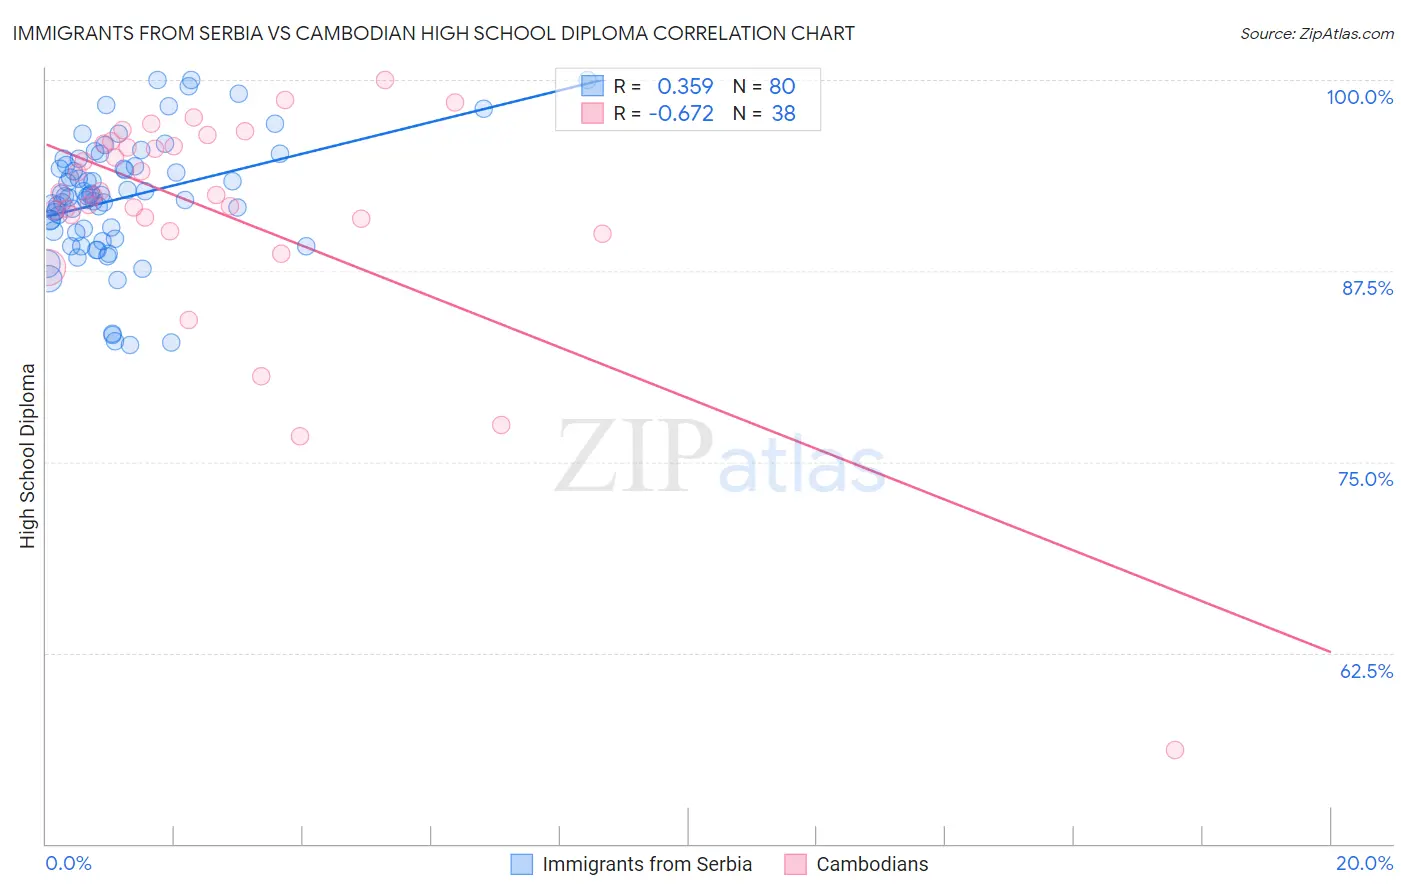
Immigrants from Serbia vs Cambodian High School Diploma Correlation Chart
The statistical analysis conducted on geographies consisting of 131,745,658 people shows a mild positive correlation between the proportion of Immigrants from Serbia and percentage of population with at least high school diploma education in the United States with a correlation coefficient (R) of 0.359 and weighted average of 90.5%. Similarly, the statistical analysis conducted on geographies consisting of 102,514,976 people shows a significant negative correlation between the proportion of Cambodians and percentage of population with at least high school diploma education in the United States with a correlation coefficient (R) of -0.672 and weighted average of 90.8%, a difference of 0.34%.
High School Diploma Correlation Summary
| Measurement | Immigrants from Serbia | Cambodian |
| Minimum | 82.6% | 56.1% |
| Maximum | 100.0% | 100.0% |
| Range | 17.4% | 43.9% |
| Mean | 92.3% | 91.3% |
| Median | 92.4% | 92.6% |
| Interquartile 25% (IQ1) | 90.1% | 90.9% |
| Interquartile 75% (IQ3) | 94.4% | 95.8% |
| Interquartile Range (IQR) | 4.3% | 4.9% |
| Standard Deviation (Sample) | 3.9% | 7.9% |
| Standard Deviation (Population) | 3.9% | 7.8% |
Similar Demographics by High School Diploma
Demographics Similar to Immigrants from Serbia by High School Diploma
In terms of high school diploma, the demographic groups most similar to Immigrants from Serbia are Immigrants from Israel (90.5%, a difference of 0.010%), Icelander (90.5%, a difference of 0.010%), Immigrants from Kuwait (90.5%, a difference of 0.030%), Immigrants from Korea (90.5%, a difference of 0.030%), and Swiss (90.6%, a difference of 0.040%).
| Demographics | Rating | Rank | High School Diploma |
| Canadians | 98.7 /100 | #89 | Exceptional 90.6% |
| Celtics | 98.7 /100 | #90 | Exceptional 90.6% |
| South Africans | 98.6 /100 | #91 | Exceptional 90.6% |
| Swiss | 98.6 /100 | #92 | Exceptional 90.6% |
| Immigrants | Western Europe | 98.6 /100 | #93 | Exceptional 90.6% |
| Immigrants | Israel | 98.5 /100 | #94 | Exceptional 90.5% |
| Icelanders | 98.5 /100 | #95 | Exceptional 90.5% |
| Immigrants | Serbia | 98.4 /100 | #96 | Exceptional 90.5% |
| Immigrants | Kuwait | 98.3 /100 | #97 | Exceptional 90.5% |
| Immigrants | Korea | 98.3 /100 | #98 | Exceptional 90.5% |
| Immigrants | Europe | 98.2 /100 | #99 | Exceptional 90.5% |
| Immigrants | North Macedonia | 98.1 /100 | #100 | Exceptional 90.5% |
| Immigrants | Norway | 98.0 /100 | #101 | Exceptional 90.5% |
| Aleuts | 98.0 /100 | #102 | Exceptional 90.4% |
| Immigrants | Romania | 97.8 /100 | #103 | Exceptional 90.4% |
Demographics Similar to Cambodians by High School Diploma
In terms of high school diploma, the demographic groups most similar to Cambodians are Hungarian (90.8%, a difference of 0.010%), Immigrants from South Central Asia (90.9%, a difference of 0.020%), Immigrants from Czechoslovakia (90.9%, a difference of 0.020%), Native Hawaiian (90.8%, a difference of 0.020%), and Burmese (90.8%, a difference of 0.020%).
| Demographics | Rating | Rank | High School Diploma |
| Czechoslovakians | 99.5 /100 | #68 | Exceptional 90.9% |
| French Canadians | 99.5 /100 | #69 | Exceptional 90.9% |
| Immigrants | Latvia | 99.5 /100 | #70 | Exceptional 90.9% |
| Alaskan Athabascans | 99.4 /100 | #71 | Exceptional 90.9% |
| Soviet Union | 99.4 /100 | #72 | Exceptional 90.9% |
| Immigrants | South Central Asia | 99.4 /100 | #73 | Exceptional 90.9% |
| Immigrants | Czechoslovakia | 99.4 /100 | #74 | Exceptional 90.9% |
| Cambodians | 99.4 /100 | #75 | Exceptional 90.8% |
| Hungarians | 99.3 /100 | #76 | Exceptional 90.8% |
| Native Hawaiians | 99.3 /100 | #77 | Exceptional 90.8% |
| Burmese | 99.3 /100 | #78 | Exceptional 90.8% |
| Immigrants | Denmark | 99.3 /100 | #79 | Exceptional 90.8% |
| Immigrants | England | 99.3 /100 | #80 | Exceptional 90.8% |
| Immigrants | Switzerland | 99.3 /100 | #81 | Exceptional 90.8% |
| Scotch-Irish | 99.2 /100 | #82 | Exceptional 90.8% |