Immigrants from Serbia vs Albanian 7th Grade
COMPARE
Immigrants from Serbia
Albanian
7th Grade
7th Grade Comparison
Immigrants from Serbia
Albanians
96.4%
7TH GRADE
92.8/ 100
METRIC RATING
130th/ 347
METRIC RANK
96.3%
7TH GRADE
82.6/ 100
METRIC RATING
149th/ 347
METRIC RANK
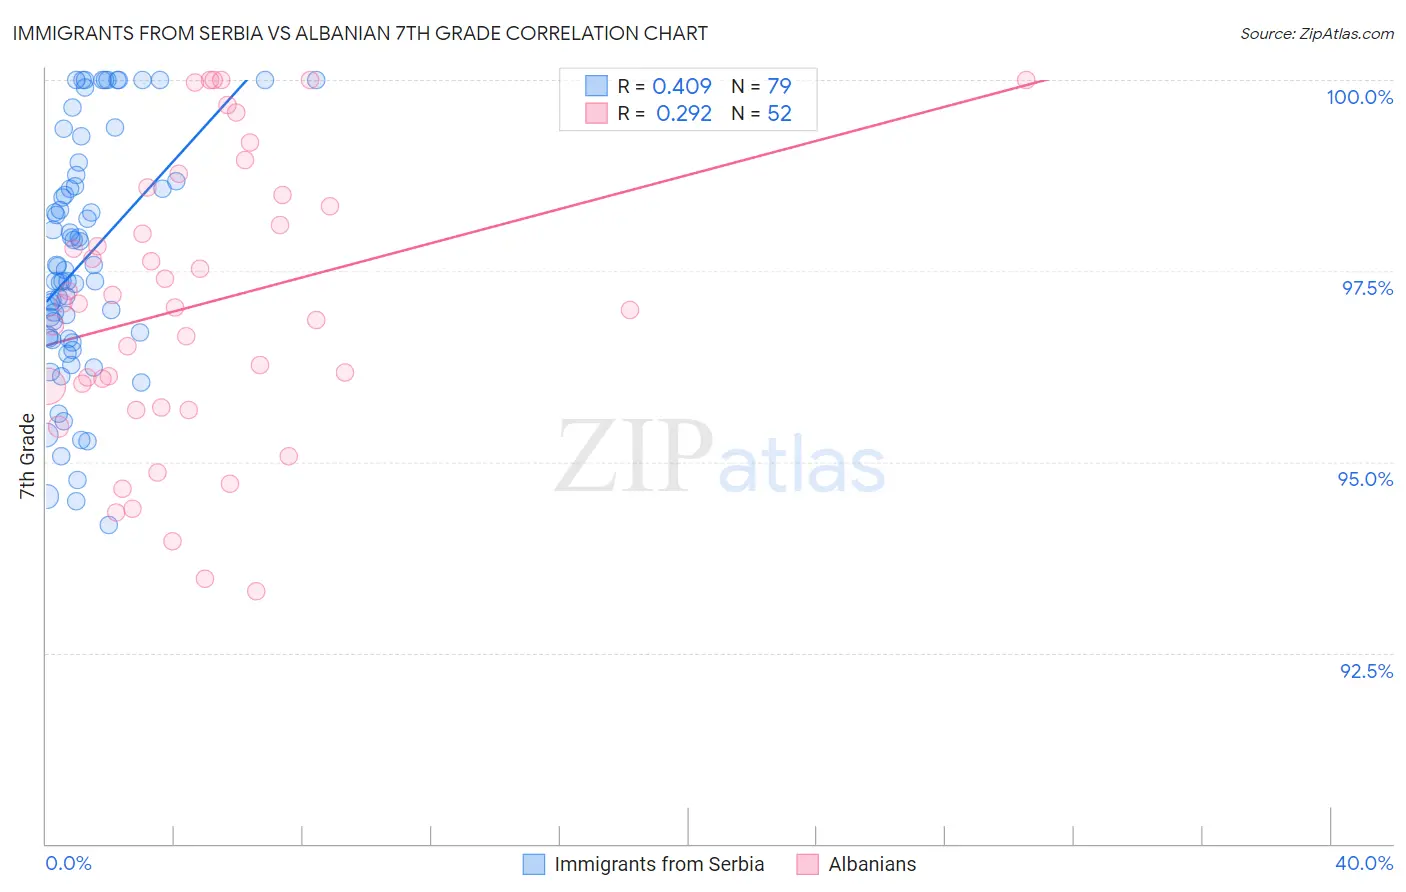
Immigrants from Serbia vs Albanian 7th Grade Correlation Chart
The statistical analysis conducted on geographies consisting of 131,729,423 people shows a moderate positive correlation between the proportion of Immigrants from Serbia and percentage of population with at least 7th grade education in the United States with a correlation coefficient (R) of 0.409 and weighted average of 96.4%. Similarly, the statistical analysis conducted on geographies consisting of 193,265,850 people shows a weak positive correlation between the proportion of Albanians and percentage of population with at least 7th grade education in the United States with a correlation coefficient (R) of 0.292 and weighted average of 96.3%, a difference of 0.15%.
7th Grade Correlation Summary
| Measurement | Immigrants from Serbia | Albanian |
| Minimum | 94.2% | 93.3% |
| Maximum | 100.0% | 100.0% |
| Range | 5.8% | 6.7% |
| Mean | 97.6% | 97.1% |
| Median | 97.5% | 97.0% |
| Interquartile 25% (IQ1) | 96.6% | 95.9% |
| Interquartile 75% (IQ3) | 98.7% | 98.4% |
| Interquartile Range (IQR) | 2.1% | 2.6% |
| Standard Deviation (Sample) | 1.6% | 1.8% |
| Standard Deviation (Population) | 1.6% | 1.8% |
Demographics Similar to Immigrants from Serbia and Albanians by 7th Grade
In terms of 7th grade, the demographic groups most similar to Immigrants from Serbia are Immigrants from North Macedonia (96.4%, a difference of 0.010%), Filipino (96.4%, a difference of 0.020%), Colville (96.4%, a difference of 0.020%), Hmong (96.4%, a difference of 0.030%), and Soviet Union (96.4%, a difference of 0.030%). Similarly, the demographic groups most similar to Albanians are French American Indian (96.3%, a difference of 0.0%), Israeli (96.3%, a difference of 0.0%), Blackfeet (96.3%, a difference of 0.010%), Immigrants from Eastern Europe (96.3%, a difference of 0.010%), and Immigrants from Greece (96.3%, a difference of 0.040%).
| Demographics | Rating | Rank | 7th Grade |
| Immigrants | North Macedonia | 93.1 /100 | #129 | Exceptional 96.4% |
| Immigrants | Serbia | 92.8 /100 | #130 | Exceptional 96.4% |
| Filipinos | 92.1 /100 | #131 | Exceptional 96.4% |
| Colville | 91.7 /100 | #132 | Exceptional 96.4% |
| Hmong | 91.5 /100 | #133 | Exceptional 96.4% |
| Soviet Union | 91.2 /100 | #134 | Exceptional 96.4% |
| Immigrants | Kuwait | 91.1 /100 | #135 | Exceptional 96.4% |
| Immigrants | Hungary | 90.6 /100 | #136 | Exceptional 96.4% |
| Immigrants | Turkey | 90.2 /100 | #137 | Exceptional 96.4% |
| Jordanians | 90.0 /100 | #138 | Excellent 96.4% |
| Basques | 89.3 /100 | #139 | Excellent 96.4% |
| Cambodians | 88.3 /100 | #140 | Excellent 96.3% |
| Immigrants | South Central Asia | 87.1 /100 | #141 | Excellent 96.3% |
| Burmese | 87.1 /100 | #142 | Excellent 96.3% |
| Spanish | 86.6 /100 | #143 | Excellent 96.3% |
| Immigrants | Greece | 85.9 /100 | #144 | Excellent 96.3% |
| Blackfeet | 83.9 /100 | #145 | Excellent 96.3% |
| Immigrants | Eastern Europe | 83.7 /100 | #146 | Excellent 96.3% |
| French American Indians | 83.1 /100 | #147 | Excellent 96.3% |
| Israelis | 82.8 /100 | #148 | Excellent 96.3% |
| Albanians | 82.6 /100 | #149 | Excellent 96.3% |