Immigrants from Serbia vs Albanian Householder Income Under 25 years
COMPARE
Immigrants from Serbia
Albanian
Householder Income Under 25 years
Householder Income Under 25 years Comparison
Immigrants from Serbia
Albanians
$53,321
HOUSEHOLDER INCOME UNDER 25 YEARS
94.1/ 100
METRIC RATING
126th/ 347
METRIC RANK
$53,794
HOUSEHOLDER INCOME UNDER 25 YEARS
98.1/ 100
METRIC RATING
106th/ 347
METRIC RANK
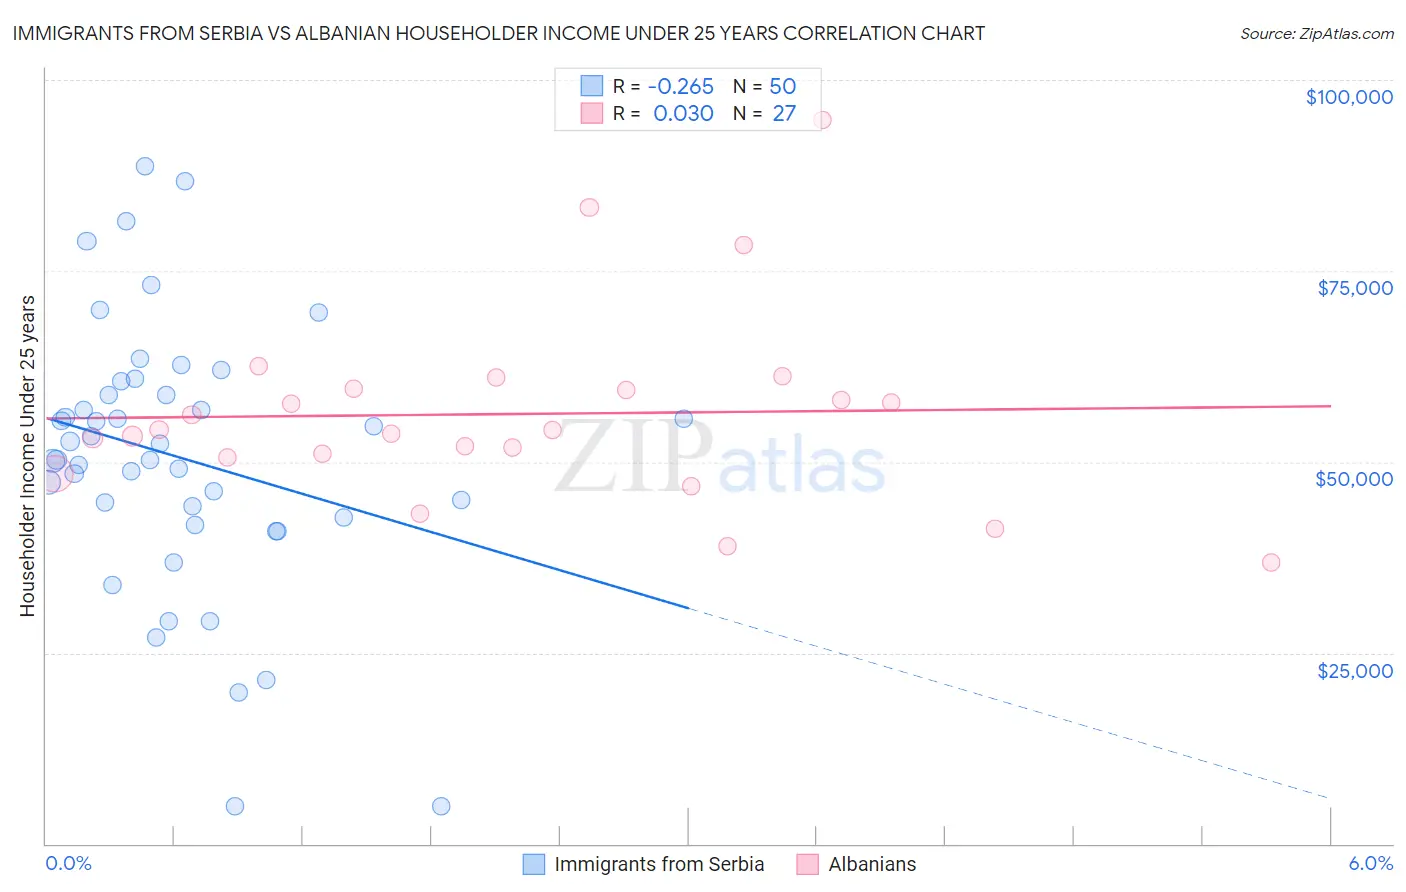
Immigrants from Serbia vs Albanian Householder Income Under 25 years Correlation Chart
The statistical analysis conducted on geographies consisting of 120,272,862 people shows a weak negative correlation between the proportion of Immigrants from Serbia and household income with householder under the age of 25 in the United States with a correlation coefficient (R) of -0.265 and weighted average of $53,321. Similarly, the statistical analysis conducted on geographies consisting of 168,875,521 people shows no correlation between the proportion of Albanians and household income with householder under the age of 25 in the United States with a correlation coefficient (R) of 0.030 and weighted average of $53,794, a difference of 0.89%.
Householder Income Under 25 years Correlation Summary
| Measurement | Immigrants from Serbia | Albanian |
| Minimum | $4,881 | $36,785 |
| Maximum | $88,661 | $94,768 |
| Range | $83,780 | $57,984 |
| Mean | $50,549 | $56,271 |
| Median | $51,356 | $54,178 |
| Interquartile 25% (IQ1) | $42,708 | $50,650 |
| Interquartile 75% (IQ3) | $58,831 | $59,543 |
| Interquartile Range (IQR) | $16,123 | $8,893 |
| Standard Deviation (Sample) | $17,589 | $12,666 |
| Standard Deviation (Population) | $17,412 | $12,429 |
Demographics Similar to Immigrants from Serbia and Albanians by Householder Income Under 25 years
In terms of householder income under 25 years, the demographic groups most similar to Immigrants from Serbia are Pakistani ($53,325, a difference of 0.010%), Colombian ($53,357, a difference of 0.070%), Immigrants from Iraq ($53,384, a difference of 0.12%), Immigrants from Ethiopia ($53,408, a difference of 0.16%), and Immigrants from Canada ($53,411, a difference of 0.17%). Similarly, the demographic groups most similar to Albanians are Australian ($53,739, a difference of 0.10%), Maltese ($53,735, a difference of 0.11%), Immigrants from Ecuador ($53,722, a difference of 0.13%), Greek ($53,715, a difference of 0.15%), and Immigrants from Colombia ($53,714, a difference of 0.15%).
| Demographics | Rating | Rank | Householder Income Under 25 years |
| Albanians | 98.1 /100 | #106 | Exceptional $53,794 |
| Australians | 97.8 /100 | #107 | Exceptional $53,739 |
| Maltese | 97.8 /100 | #108 | Exceptional $53,735 |
| Immigrants | Ecuador | 97.7 /100 | #109 | Exceptional $53,722 |
| Greeks | 97.7 /100 | #110 | Exceptional $53,715 |
| Immigrants | Colombia | 97.7 /100 | #111 | Exceptional $53,714 |
| Immigrants | Oceania | 97.5 /100 | #112 | Exceptional $53,680 |
| Romanians | 97.2 /100 | #113 | Exceptional $53,632 |
| Immigrants | Sweden | 97.1 /100 | #114 | Exceptional $53,621 |
| Immigrants | Albania | 96.9 /100 | #115 | Exceptional $53,597 |
| Immigrants | Spain | 96.6 /100 | #116 | Exceptional $53,560 |
| Lithuanians | 96.6 /100 | #117 | Exceptional $53,552 |
| Immigrants | Switzerland | 96.3 /100 | #118 | Exceptional $53,528 |
| Italians | 95.4 /100 | #119 | Exceptional $53,426 |
| Guamanians/Chamorros | 95.3 /100 | #120 | Exceptional $53,423 |
| Immigrants | Canada | 95.2 /100 | #121 | Exceptional $53,411 |
| Immigrants | Ethiopia | 95.2 /100 | #122 | Exceptional $53,408 |
| Immigrants | Iraq | 94.9 /100 | #123 | Exceptional $53,384 |
| Colombians | 94.6 /100 | #124 | Exceptional $53,357 |
| Pakistanis | 94.1 /100 | #125 | Exceptional $53,325 |
| Immigrants | Serbia | 94.1 /100 | #126 | Exceptional $53,321 |