Immigrants from Serbia vs Immigrants from El Salvador 7th Grade
COMPARE
Immigrants from Serbia
Immigrants from El Salvador
7th Grade
7th Grade Comparison
Immigrants from Serbia
Immigrants from El Salvador
96.4%
7TH GRADE
92.8/ 100
METRIC RATING
130th/ 347
METRIC RANK
90.9%
7TH GRADE
0.0/ 100
METRIC RATING
345th/ 347
METRIC RANK
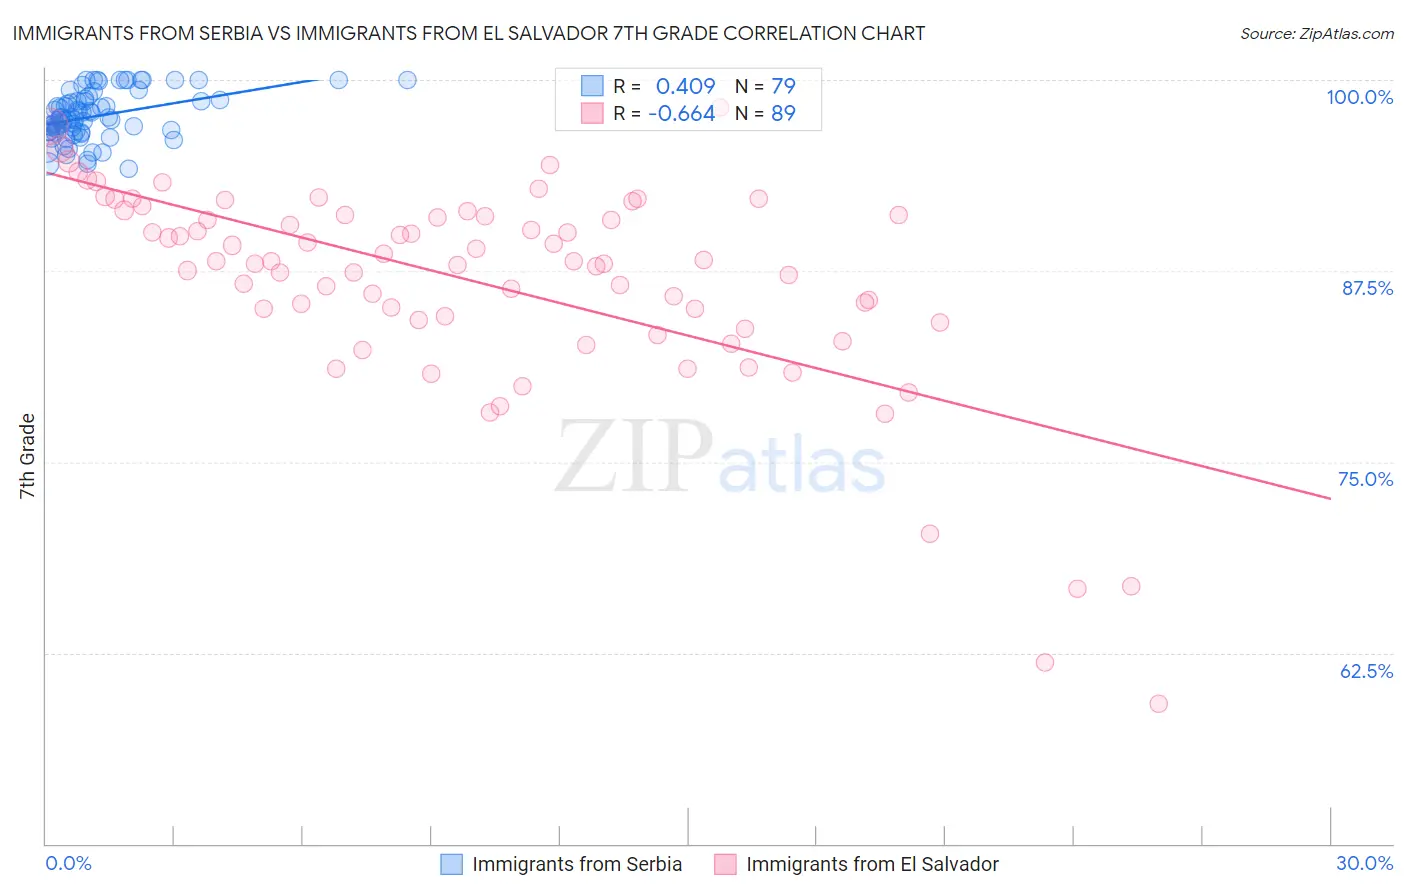
Immigrants from Serbia vs Immigrants from El Salvador 7th Grade Correlation Chart
The statistical analysis conducted on geographies consisting of 131,729,423 people shows a moderate positive correlation between the proportion of Immigrants from Serbia and percentage of population with at least 7th grade education in the United States with a correlation coefficient (R) of 0.409 and weighted average of 96.4%. Similarly, the statistical analysis conducted on geographies consisting of 357,828,194 people shows a significant negative correlation between the proportion of Immigrants from El Salvador and percentage of population with at least 7th grade education in the United States with a correlation coefficient (R) of -0.664 and weighted average of 90.9%, a difference of 6.0%.
7th Grade Correlation Summary
| Measurement | Immigrants from Serbia | Immigrants from El Salvador |
| Minimum | 94.2% | 59.1% |
| Maximum | 100.0% | 98.2% |
| Range | 5.8% | 39.1% |
| Mean | 97.6% | 86.7% |
| Median | 97.5% | 88.1% |
| Interquartile 25% (IQ1) | 96.6% | 84.2% |
| Interquartile 75% (IQ3) | 98.7% | 91.1% |
| Interquartile Range (IQR) | 2.1% | 6.9% |
| Standard Deviation (Sample) | 1.6% | 7.0% |
| Standard Deviation (Population) | 1.6% | 6.9% |
Similar Demographics by 7th Grade
Demographics Similar to Immigrants from Serbia by 7th Grade
In terms of 7th grade, the demographic groups most similar to Immigrants from Serbia are Immigrants from Bosnia and Herzegovina (96.4%, a difference of 0.010%), Immigrants from Romania (96.4%, a difference of 0.010%), Immigrants from North Macedonia (96.4%, a difference of 0.010%), Palestinian (96.4%, a difference of 0.020%), and Filipino (96.4%, a difference of 0.020%).
| Demographics | Rating | Rank | 7th Grade |
| Immigrants | France | 94.7 /100 | #123 | Exceptional 96.5% |
| Immigrants | Switzerland | 94.5 /100 | #124 | Exceptional 96.5% |
| Immigrants | Bulgaria | 94.0 /100 | #125 | Exceptional 96.4% |
| Palestinians | 93.5 /100 | #126 | Exceptional 96.4% |
| Immigrants | Bosnia and Herzegovina | 93.3 /100 | #127 | Exceptional 96.4% |
| Immigrants | Romania | 93.2 /100 | #128 | Exceptional 96.4% |
| Immigrants | North Macedonia | 93.1 /100 | #129 | Exceptional 96.4% |
| Immigrants | Serbia | 92.8 /100 | #130 | Exceptional 96.4% |
| Filipinos | 92.1 /100 | #131 | Exceptional 96.4% |
| Colville | 91.7 /100 | #132 | Exceptional 96.4% |
| Hmong | 91.5 /100 | #133 | Exceptional 96.4% |
| Soviet Union | 91.2 /100 | #134 | Exceptional 96.4% |
| Immigrants | Kuwait | 91.1 /100 | #135 | Exceptional 96.4% |
| Immigrants | Hungary | 90.6 /100 | #136 | Exceptional 96.4% |
| Immigrants | Turkey | 90.2 /100 | #137 | Exceptional 96.4% |
Demographics Similar to Immigrants from El Salvador by 7th Grade
In terms of 7th grade, the demographic groups most similar to Immigrants from El Salvador are Immigrants from Central America (91.0%, a difference of 0.060%), Immigrants from Mexico (90.7%, a difference of 0.20%), Immigrants from Guatemala (91.3%, a difference of 0.43%), Salvadoran (91.5%, a difference of 0.59%), and Spanish American Indian (90.3%, a difference of 0.68%).
| Demographics | Rating | Rank | 7th Grade |
| Immigrants | Armenia | 0.0 /100 | #333 | Tragic 92.7% |
| Immigrants | Yemen | 0.0 /100 | #334 | Tragic 92.6% |
| Mexican American Indians | 0.0 /100 | #335 | Tragic 92.6% |
| Immigrants | Honduras | 0.0 /100 | #336 | Tragic 92.5% |
| Immigrants | Latin America | 0.0 /100 | #337 | Tragic 92.2% |
| Central Americans | 0.0 /100 | #338 | Tragic 92.1% |
| Mexicans | 0.0 /100 | #339 | Tragic 91.9% |
| Yakama | 0.0 /100 | #340 | Tragic 91.7% |
| Guatemalans | 0.0 /100 | #341 | Tragic 91.7% |
| Salvadorans | 0.0 /100 | #342 | Tragic 91.5% |
| Immigrants | Guatemala | 0.0 /100 | #343 | Tragic 91.3% |
| Immigrants | Central America | 0.0 /100 | #344 | Tragic 91.0% |
| Immigrants | El Salvador | 0.0 /100 | #345 | Tragic 90.9% |
| Immigrants | Mexico | 0.0 /100 | #346 | Tragic 90.7% |
| Spanish American Indians | 0.0 /100 | #347 | Tragic 90.3% |