Immigrants from Kenya vs Welsh 10th Grade
COMPARE
Immigrants from Kenya
Welsh
10th Grade
10th Grade Comparison
Immigrants from Kenya
Welsh
94.0%
10TH GRADE
75.3/ 100
METRIC RATING
154th/ 347
METRIC RANK
95.5%
10TH GRADE
100.0/ 100
METRIC RATING
26th/ 347
METRIC RANK
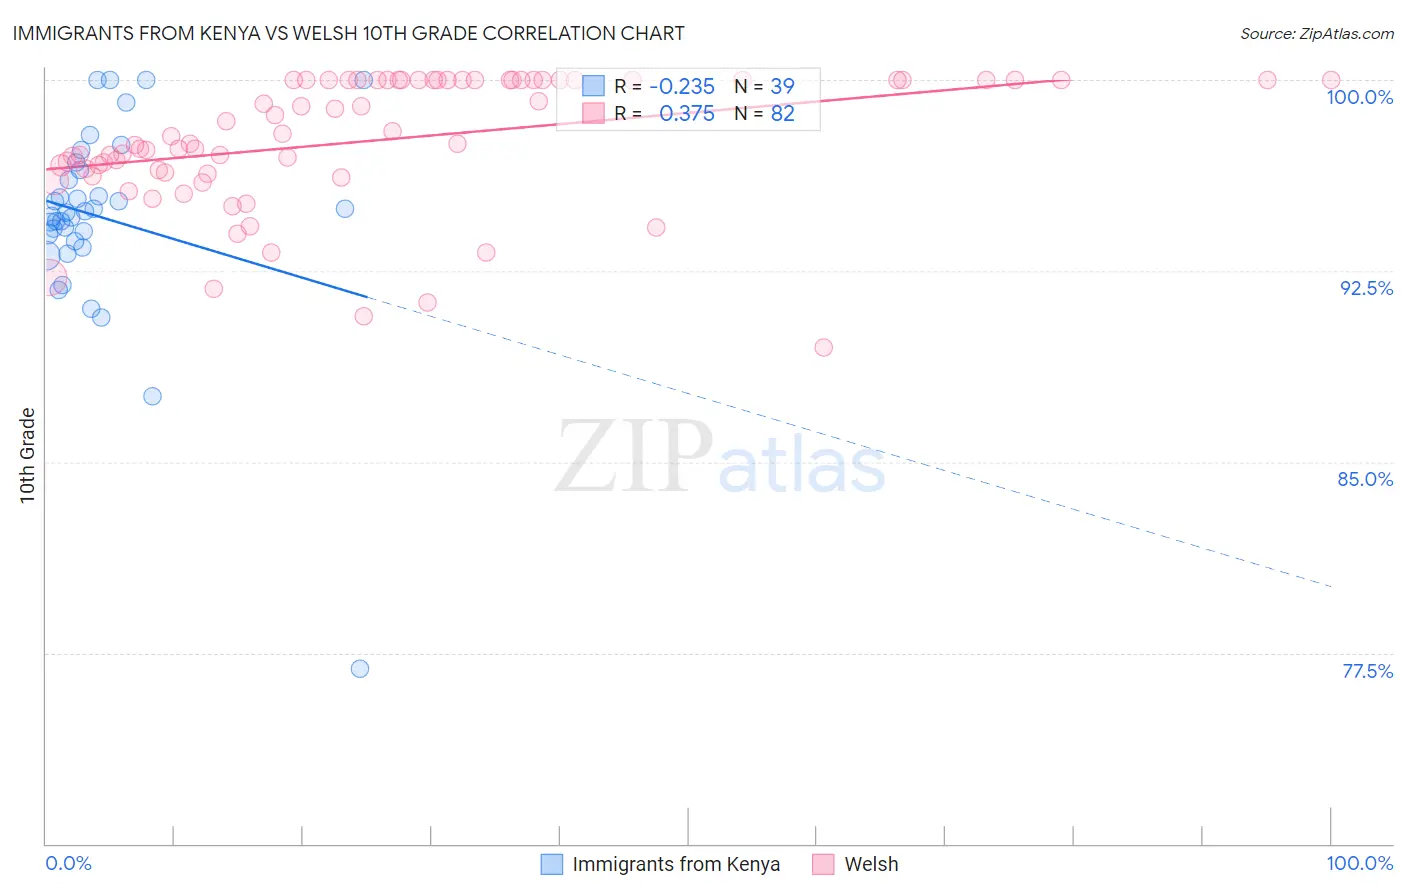
Immigrants from Kenya vs Welsh 10th Grade Correlation Chart
The statistical analysis conducted on geographies consisting of 218,076,690 people shows a weak negative correlation between the proportion of Immigrants from Kenya and percentage of population with at least 10th grade education in the United States with a correlation coefficient (R) of -0.235 and weighted average of 94.0%. Similarly, the statistical analysis conducted on geographies consisting of 528,594,177 people shows a mild positive correlation between the proportion of Welsh and percentage of population with at least 10th grade education in the United States with a correlation coefficient (R) of 0.375 and weighted average of 95.5%, a difference of 1.6%.
10th Grade Correlation Summary
| Measurement | Immigrants from Kenya | Welsh |
| Minimum | 76.9% | 89.5% |
| Maximum | 100.0% | 100.0% |
| Range | 23.1% | 10.5% |
| Mean | 94.6% | 97.6% |
| Median | 94.8% | 97.6% |
| Interquartile 25% (IQ1) | 93.6% | 96.3% |
| Interquartile 75% (IQ3) | 96.4% | 100.0% |
| Interquartile Range (IQR) | 2.8% | 3.7% |
| Standard Deviation (Sample) | 3.9% | 2.6% |
| Standard Deviation (Population) | 3.9% | 2.5% |
Similar Demographics by 10th Grade
Demographics Similar to Immigrants from Kenya by 10th Grade
In terms of 10th grade, the demographic groups most similar to Immigrants from Kenya are Immigrants from Brazil (94.0%, a difference of 0.0%), Spanish (94.0%, a difference of 0.0%), Mongolian (94.0%, a difference of 0.010%), Kiowa (93.9%, a difference of 0.020%), and Immigrants from Italy (94.0%, a difference of 0.030%).
| Demographics | Rating | Rank | 10th Grade |
| Immigrants | Ukraine | 81.5 /100 | #147 | Excellent 94.0% |
| Arabs | 80.9 /100 | #148 | Excellent 94.0% |
| Ugandans | 80.7 /100 | #149 | Excellent 94.0% |
| Egyptians | 79.6 /100 | #150 | Good 94.0% |
| Kenyans | 79.1 /100 | #151 | Good 94.0% |
| Immigrants | Italy | 78.0 /100 | #152 | Good 94.0% |
| Immigrants | Brazil | 75.5 /100 | #153 | Good 94.0% |
| Immigrants | Kenya | 75.3 /100 | #154 | Good 94.0% |
| Spanish | 74.9 /100 | #155 | Good 94.0% |
| Mongolians | 74.4 /100 | #156 | Good 94.0% |
| Kiowa | 73.3 /100 | #157 | Good 93.9% |
| Bermudans | 71.0 /100 | #158 | Good 93.9% |
| Chileans | 70.2 /100 | #159 | Good 93.9% |
| Pakistanis | 70.1 /100 | #160 | Good 93.9% |
| Assyrians/Chaldeans/Syriacs | 69.7 /100 | #161 | Good 93.9% |
Demographics Similar to Welsh by 10th Grade
In terms of 10th grade, the demographic groups most similar to Welsh are European (95.5%, a difference of 0.020%), Maltese (95.5%, a difference of 0.020%), Alaskan Athabascan (95.4%, a difference of 0.020%), Luxembourger (95.4%, a difference of 0.020%), and Czech (95.5%, a difference of 0.030%).
| Demographics | Rating | Rank | 10th Grade |
| Scandinavians | 100.0 /100 | #19 | Exceptional 95.6% |
| Chinese | 100.0 /100 | #20 | Exceptional 95.5% |
| Dutch | 100.0 /100 | #21 | Exceptional 95.5% |
| Eastern Europeans | 100.0 /100 | #22 | Exceptional 95.5% |
| Czechs | 100.0 /100 | #23 | Exceptional 95.5% |
| Europeans | 100.0 /100 | #24 | Exceptional 95.5% |
| Maltese | 100.0 /100 | #25 | Exceptional 95.5% |
| Welsh | 100.0 /100 | #26 | Exceptional 95.5% |
| Alaskan Athabascans | 100.0 /100 | #27 | Exceptional 95.4% |
| Luxembourgers | 100.0 /100 | #28 | Exceptional 95.4% |
| Bulgarians | 100.0 /100 | #29 | Exceptional 95.4% |
| Belgians | 100.0 /100 | #30 | Exceptional 95.4% |
| Iranians | 100.0 /100 | #31 | Exceptional 95.3% |
| Hungarians | 100.0 /100 | #32 | Exceptional 95.3% |
| French | 100.0 /100 | #33 | Exceptional 95.3% |