Immigrants from Scotland vs Samoan 6th Grade
COMPARE
Immigrants from Scotland
Samoan
6th Grade
6th Grade Comparison
Immigrants from Scotland
Samoans
97.8%
6TH GRADE
99.8/ 100
METRIC RATING
50th/ 347
METRIC RANK
96.8%
6TH GRADE
11.0/ 100
METRIC RATING
208th/ 347
METRIC RANK
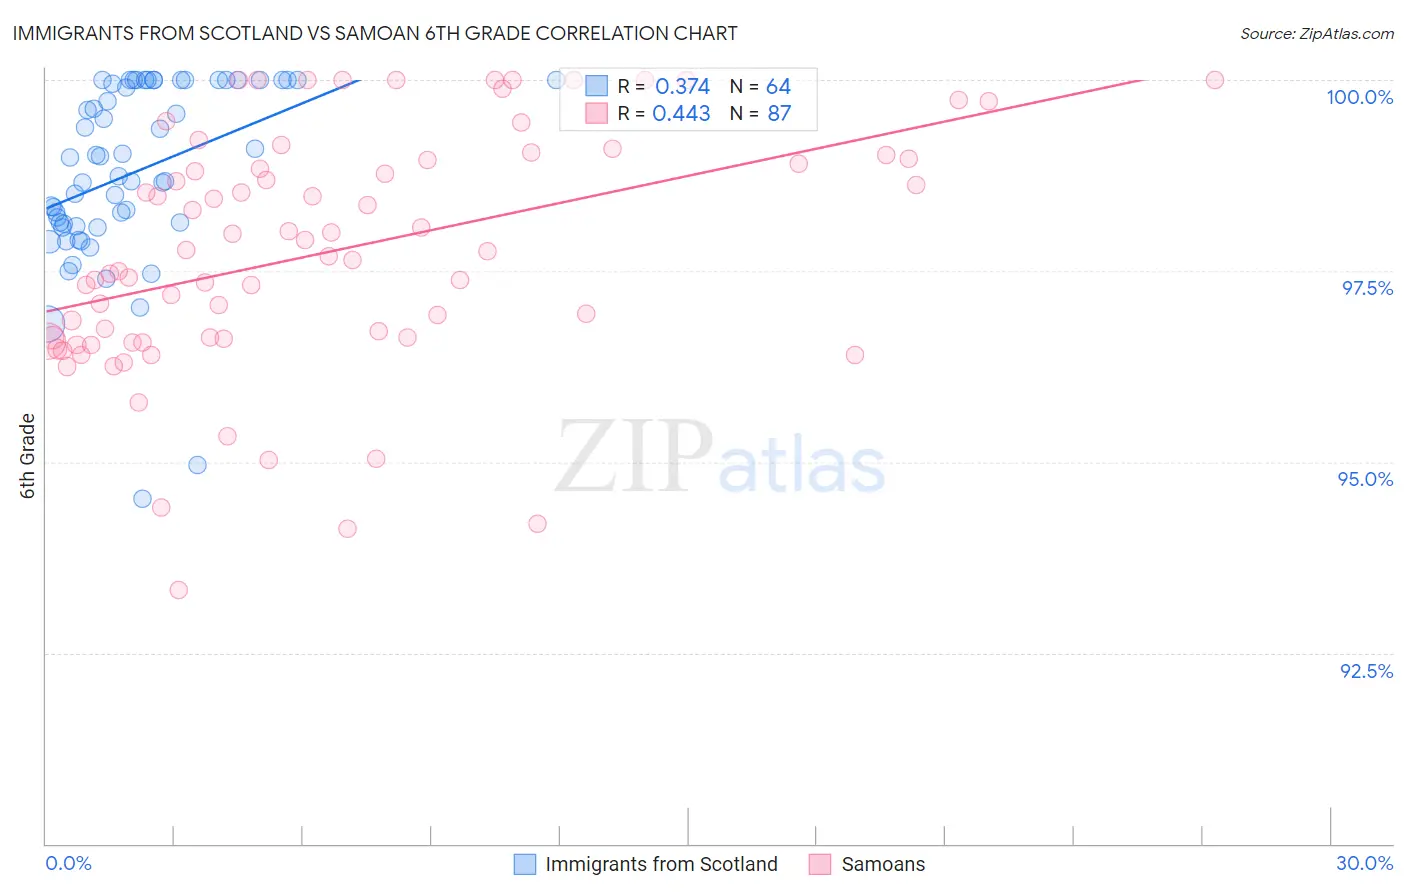
Immigrants from Scotland vs Samoan 6th Grade Correlation Chart
The statistical analysis conducted on geographies consisting of 196,398,887 people shows a mild positive correlation between the proportion of Immigrants from Scotland and percentage of population with at least 6th grade education in the United States with a correlation coefficient (R) of 0.374 and weighted average of 97.8%. Similarly, the statistical analysis conducted on geographies consisting of 225,201,909 people shows a moderate positive correlation between the proportion of Samoans and percentage of population with at least 6th grade education in the United States with a correlation coefficient (R) of 0.443 and weighted average of 96.8%, a difference of 0.98%.
6th Grade Correlation Summary
| Measurement | Immigrants from Scotland | Samoan |
| Minimum | 94.5% | 93.3% |
| Maximum | 100.0% | 100.0% |
| Range | 5.5% | 6.7% |
| Mean | 98.8% | 97.8% |
| Median | 98.9% | 97.8% |
| Interquartile 25% (IQ1) | 98.1% | 96.6% |
| Interquartile 75% (IQ3) | 100.0% | 99.0% |
| Interquartile Range (IQR) | 1.9% | 2.4% |
| Standard Deviation (Sample) | 1.2% | 1.6% |
| Standard Deviation (Population) | 1.2% | 1.6% |
Similar Demographics by 6th Grade
Demographics Similar to Immigrants from Scotland by 6th Grade
In terms of 6th grade, the demographic groups most similar to Immigrants from Scotland are Native Hawaiian (97.8%, a difference of 0.0%), Celtic (97.8%, a difference of 0.0%), Estonian (97.8%, a difference of 0.0%), Arapaho (97.8%, a difference of 0.010%), and Maltese (97.8%, a difference of 0.010%).
| Demographics | Rating | Rank | 6th Grade |
| Northern Europeans | 99.9 /100 | #43 | Exceptional 97.8% |
| Czechoslovakians | 99.9 /100 | #44 | Exceptional 97.8% |
| Bulgarians | 99.9 /100 | #45 | Exceptional 97.8% |
| Arapaho | 99.9 /100 | #46 | Exceptional 97.8% |
| Native Hawaiians | 99.9 /100 | #47 | Exceptional 97.8% |
| Celtics | 99.9 /100 | #48 | Exceptional 97.8% |
| Estonians | 99.8 /100 | #49 | Exceptional 97.8% |
| Immigrants | Scotland | 99.8 /100 | #50 | Exceptional 97.8% |
| Maltese | 99.8 /100 | #51 | Exceptional 97.8% |
| Australians | 99.8 /100 | #52 | Exceptional 97.8% |
| Slavs | 99.8 /100 | #53 | Exceptional 97.8% |
| Creek | 99.8 /100 | #54 | Exceptional 97.7% |
| Aleuts | 99.8 /100 | #55 | Exceptional 97.7% |
| Austrians | 99.8 /100 | #56 | Exceptional 97.7% |
| Whites/Caucasians | 99.8 /100 | #57 | Exceptional 97.7% |
Demographics Similar to Samoans by 6th Grade
In terms of 6th grade, the demographic groups most similar to Samoans are Immigrants from Oceania (96.8%, a difference of 0.0%), Laotian (96.8%, a difference of 0.010%), Iraqi (96.8%, a difference of 0.010%), Immigrants from Nepal (96.8%, a difference of 0.010%), and Native/Alaskan (96.8%, a difference of 0.020%).
| Demographics | Rating | Rank | 6th Grade |
| Immigrants | Zaire | 14.5 /100 | #201 | Poor 96.9% |
| Immigrants | Chile | 14.2 /100 | #202 | Poor 96.8% |
| Sudanese | 13.9 /100 | #203 | Poor 96.8% |
| Immigrants | Bahamas | 13.8 /100 | #204 | Poor 96.8% |
| Natives/Alaskans | 13.0 /100 | #205 | Poor 96.8% |
| Laotians | 11.8 /100 | #206 | Poor 96.8% |
| Iraqis | 11.7 /100 | #207 | Poor 96.8% |
| Samoans | 11.0 /100 | #208 | Poor 96.8% |
| Immigrants | Oceania | 11.0 /100 | #209 | Poor 96.8% |
| Immigrants | Nepal | 10.1 /100 | #210 | Poor 96.8% |
| Immigrants | Iraq | 9.2 /100 | #211 | Tragic 96.8% |
| Moroccans | 9.0 /100 | #212 | Tragic 96.8% |
| Immigrants | Sudan | 8.7 /100 | #213 | Tragic 96.8% |
| Portuguese | 8.2 /100 | #214 | Tragic 96.8% |
| Sierra Leoneans | 8.0 /100 | #215 | Tragic 96.8% |