Salvadoran vs Samoan 6th Grade
COMPARE
Salvadoran
Samoan
6th Grade
6th Grade Comparison
Salvadorans
Samoans
93.9%
6TH GRADE
0.0/ 100
METRIC RATING
345th/ 347
METRIC RANK
96.8%
6TH GRADE
11.0/ 100
METRIC RATING
208th/ 347
METRIC RANK
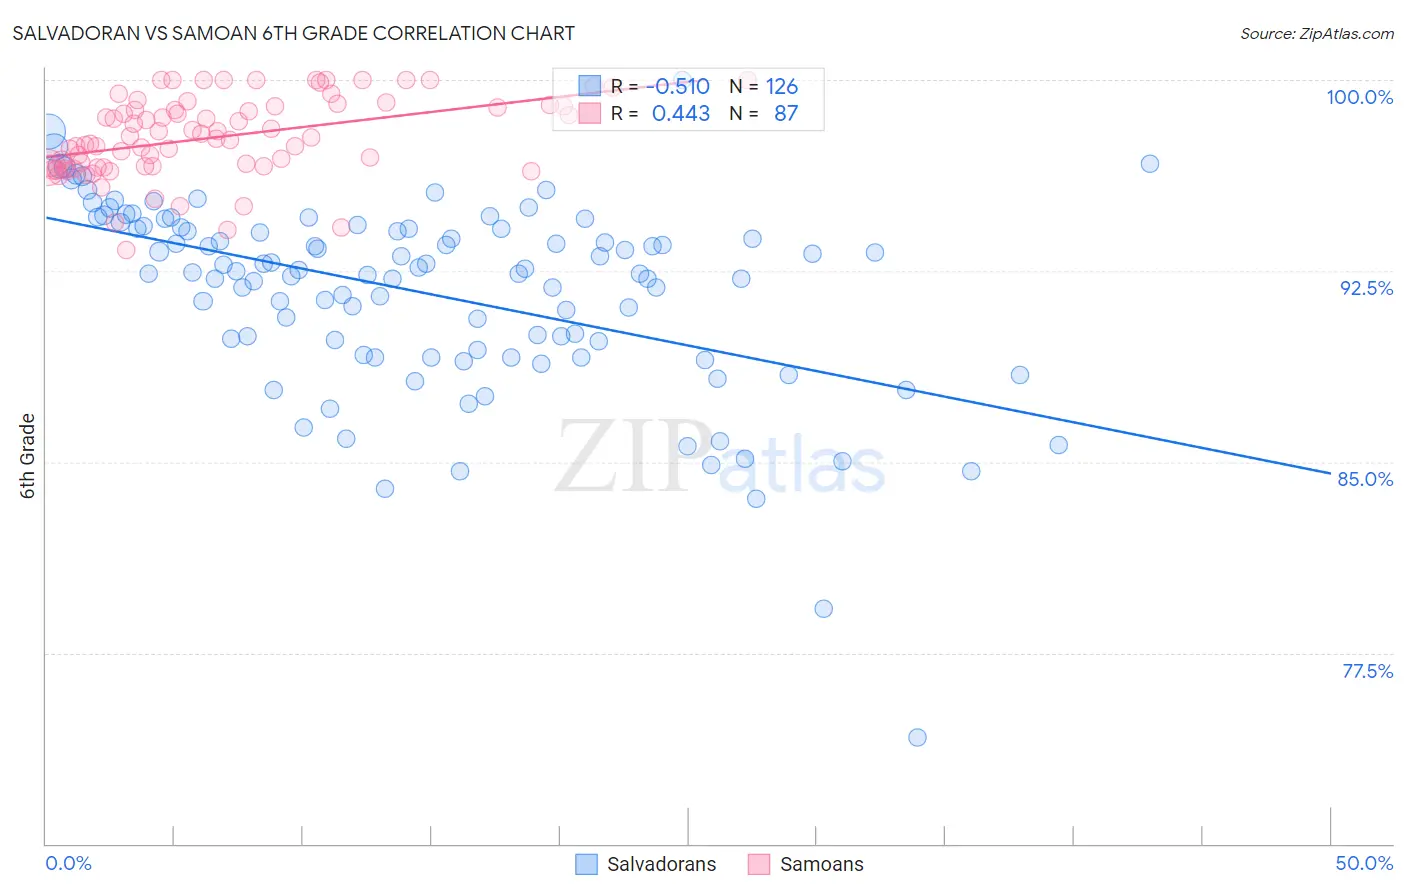
Salvadoran vs Samoan 6th Grade Correlation Chart
The statistical analysis conducted on geographies consisting of 399,033,726 people shows a substantial negative correlation between the proportion of Salvadorans and percentage of population with at least 6th grade education in the United States with a correlation coefficient (R) of -0.510 and weighted average of 93.9%. Similarly, the statistical analysis conducted on geographies consisting of 225,201,909 people shows a moderate positive correlation between the proportion of Samoans and percentage of population with at least 6th grade education in the United States with a correlation coefficient (R) of 0.443 and weighted average of 96.8%, a difference of 3.1%.
6th Grade Correlation Summary
| Measurement | Salvadoran | Samoan |
| Minimum | 74.2% | 93.3% |
| Maximum | 100.0% | 100.0% |
| Range | 25.8% | 6.7% |
| Mean | 91.6% | 97.8% |
| Median | 92.5% | 97.8% |
| Interquartile 25% (IQ1) | 89.4% | 96.6% |
| Interquartile 75% (IQ3) | 94.2% | 99.0% |
| Interquartile Range (IQR) | 4.8% | 2.4% |
| Standard Deviation (Sample) | 3.8% | 1.6% |
| Standard Deviation (Population) | 3.8% | 1.6% |
Similar Demographics by 6th Grade
Demographics Similar to Salvadorans by 6th Grade
In terms of 6th grade, the demographic groups most similar to Salvadorans are Immigrants from Guatemala (93.9%, a difference of 0.0%), Immigrants from Mexico (93.9%, a difference of 0.010%), Immigrants from Central America (94.0%, a difference of 0.070%), Immigrants from Yemen (94.1%, a difference of 0.17%), and Guatemalan (94.2%, a difference of 0.28%).
| Demographics | Rating | Rank | 6th Grade |
| Immigrants | Latin America | 0.0 /100 | #333 | Tragic 94.7% |
| Immigrants | Azores | 0.0 /100 | #334 | Tragic 94.7% |
| Mexicans | 0.0 /100 | #335 | Tragic 94.6% |
| Immigrants | Dominican Republic | 0.0 /100 | #336 | Tragic 94.6% |
| Central Americans | 0.0 /100 | #337 | Tragic 94.5% |
| Immigrants | Cabo Verde | 0.0 /100 | #338 | Tragic 94.4% |
| Yakama | 0.0 /100 | #339 | Tragic 94.3% |
| Guatemalans | 0.0 /100 | #340 | Tragic 94.2% |
| Immigrants | Yemen | 0.0 /100 | #341 | Tragic 94.1% |
| Immigrants | Central America | 0.0 /100 | #342 | Tragic 94.0% |
| Immigrants | Mexico | 0.0 /100 | #343 | Tragic 93.9% |
| Immigrants | Guatemala | 0.0 /100 | #344 | Tragic 93.9% |
| Salvadorans | 0.0 /100 | #345 | Tragic 93.9% |
| Spanish American Indians | 0.0 /100 | #346 | Tragic 93.6% |
| Immigrants | El Salvador | 0.0 /100 | #347 | Tragic 93.6% |
Demographics Similar to Samoans by 6th Grade
In terms of 6th grade, the demographic groups most similar to Samoans are Immigrants from Oceania (96.8%, a difference of 0.0%), Laotian (96.8%, a difference of 0.010%), Iraqi (96.8%, a difference of 0.010%), Immigrants from Nepal (96.8%, a difference of 0.010%), and Native/Alaskan (96.8%, a difference of 0.020%).
| Demographics | Rating | Rank | 6th Grade |
| Immigrants | Zaire | 14.5 /100 | #201 | Poor 96.9% |
| Immigrants | Chile | 14.2 /100 | #202 | Poor 96.8% |
| Sudanese | 13.9 /100 | #203 | Poor 96.8% |
| Immigrants | Bahamas | 13.8 /100 | #204 | Poor 96.8% |
| Natives/Alaskans | 13.0 /100 | #205 | Poor 96.8% |
| Laotians | 11.8 /100 | #206 | Poor 96.8% |
| Iraqis | 11.7 /100 | #207 | Poor 96.8% |
| Samoans | 11.0 /100 | #208 | Poor 96.8% |
| Immigrants | Oceania | 11.0 /100 | #209 | Poor 96.8% |
| Immigrants | Nepal | 10.1 /100 | #210 | Poor 96.8% |
| Immigrants | Iraq | 9.2 /100 | #211 | Tragic 96.8% |
| Moroccans | 9.0 /100 | #212 | Tragic 96.8% |
| Immigrants | Sudan | 8.7 /100 | #213 | Tragic 96.8% |
| Portuguese | 8.2 /100 | #214 | Tragic 96.8% |
| Sierra Leoneans | 8.0 /100 | #215 | Tragic 96.8% |