Immigrants from Scotland vs Samoan 9th Grade
COMPARE
Immigrants from Scotland
Samoan
9th Grade
9th Grade Comparison
Immigrants from Scotland
Samoans
96.1%
9TH GRADE
99.9/ 100
METRIC RATING
38th/ 347
METRIC RANK
94.6%
9TH GRADE
17.3/ 100
METRIC RATING
206th/ 347
METRIC RANK
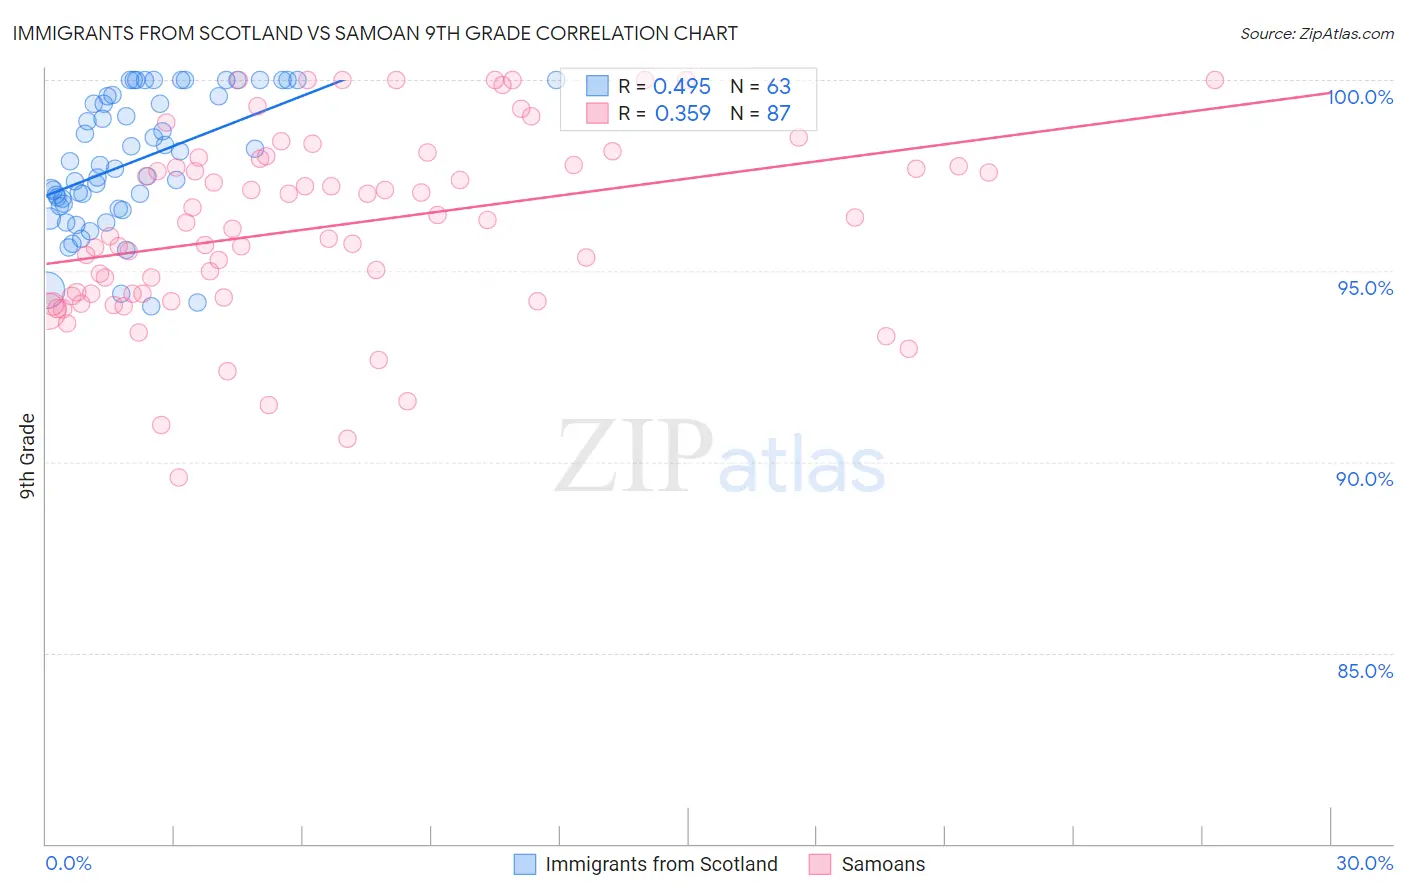
Immigrants from Scotland vs Samoan 9th Grade Correlation Chart
The statistical analysis conducted on geographies consisting of 196,394,967 people shows a moderate positive correlation between the proportion of Immigrants from Scotland and percentage of population with at least 9th grade education in the United States with a correlation coefficient (R) of 0.495 and weighted average of 96.1%. Similarly, the statistical analysis conducted on geographies consisting of 225,201,909 people shows a mild positive correlation between the proportion of Samoans and percentage of population with at least 9th grade education in the United States with a correlation coefficient (R) of 0.359 and weighted average of 94.6%, a difference of 1.6%.
9th Grade Correlation Summary
| Measurement | Immigrants from Scotland | Samoan |
| Minimum | 94.1% | 89.6% |
| Maximum | 100.0% | 100.0% |
| Range | 5.9% | 10.4% |
| Mean | 97.9% | 96.2% |
| Median | 97.8% | 96.3% |
| Interquartile 25% (IQ1) | 96.7% | 94.3% |
| Interquartile 75% (IQ3) | 99.6% | 97.9% |
| Interquartile Range (IQR) | 2.9% | 3.6% |
| Standard Deviation (Sample) | 1.7% | 2.4% |
| Standard Deviation (Population) | 1.7% | 2.4% |
Similar Demographics by 9th Grade
Demographics Similar to Immigrants from Scotland by 9th Grade
In terms of 9th grade, the demographic groups most similar to Immigrants from Scotland are Estonian (96.1%, a difference of 0.0%), Ottawa (96.1%, a difference of 0.020%), Northern European (96.2%, a difference of 0.040%), Slavic (96.1%, a difference of 0.040%), and Bulgarian (96.2%, a difference of 0.050%).
| Demographics | Rating | Rank | 9th Grade |
| British | 100.0 /100 | #31 | Exceptional 96.3% |
| Belgians | 100.0 /100 | #32 | Exceptional 96.3% |
| Luxembourgers | 100.0 /100 | #33 | Exceptional 96.3% |
| Hungarians | 100.0 /100 | #34 | Exceptional 96.2% |
| Bulgarians | 99.9 /100 | #35 | Exceptional 96.2% |
| Northern Europeans | 99.9 /100 | #36 | Exceptional 96.2% |
| Estonians | 99.9 /100 | #37 | Exceptional 96.1% |
| Immigrants | Scotland | 99.9 /100 | #38 | Exceptional 96.1% |
| Ottawa | 99.9 /100 | #39 | Exceptional 96.1% |
| Slavs | 99.9 /100 | #40 | Exceptional 96.1% |
| Czechoslovakians | 99.9 /100 | #41 | Exceptional 96.1% |
| Chippewa | 99.9 /100 | #42 | Exceptional 96.1% |
| Iranians | 99.9 /100 | #43 | Exceptional 96.1% |
| Alaska Natives | 99.9 /100 | #44 | Exceptional 96.1% |
| Crow | 99.9 /100 | #45 | Exceptional 96.1% |
Demographics Similar to Samoans by 9th Grade
In terms of 9th grade, the demographic groups most similar to Samoans are Immigrants from Sudan (94.6%, a difference of 0.0%), Immigrants from Morocco (94.6%, a difference of 0.010%), Immigrants from Pakistan (94.6%, a difference of 0.020%), Immigrants from Eastern Asia (94.6%, a difference of 0.030%), and Immigrants from Bahamas (94.6%, a difference of 0.030%).
| Demographics | Rating | Rank | 9th Grade |
| Laotians | 21.0 /100 | #199 | Fair 94.6% |
| Immigrants | Zaire | 20.6 /100 | #200 | Fair 94.6% |
| Blacks/African Americans | 20.5 /100 | #201 | Fair 94.6% |
| Immigrants | Eastern Asia | 19.8 /100 | #202 | Poor 94.6% |
| Immigrants | Bahamas | 19.8 /100 | #203 | Poor 94.6% |
| Moroccans | 19.6 /100 | #204 | Poor 94.6% |
| Immigrants | Sudan | 17.6 /100 | #205 | Poor 94.6% |
| Samoans | 17.3 /100 | #206 | Poor 94.6% |
| Immigrants | Morocco | 16.3 /100 | #207 | Poor 94.6% |
| Immigrants | Pakistan | 15.5 /100 | #208 | Poor 94.6% |
| Comanche | 14.9 /100 | #209 | Poor 94.6% |
| Immigrants | Chile | 13.4 /100 | #210 | Poor 94.5% |
| Immigrants | Indonesia | 12.3 /100 | #211 | Poor 94.5% |
| Immigrants | Malaysia | 12.2 /100 | #212 | Poor 94.5% |
| Immigrants | Oceania | 12.1 /100 | #213 | Poor 94.5% |