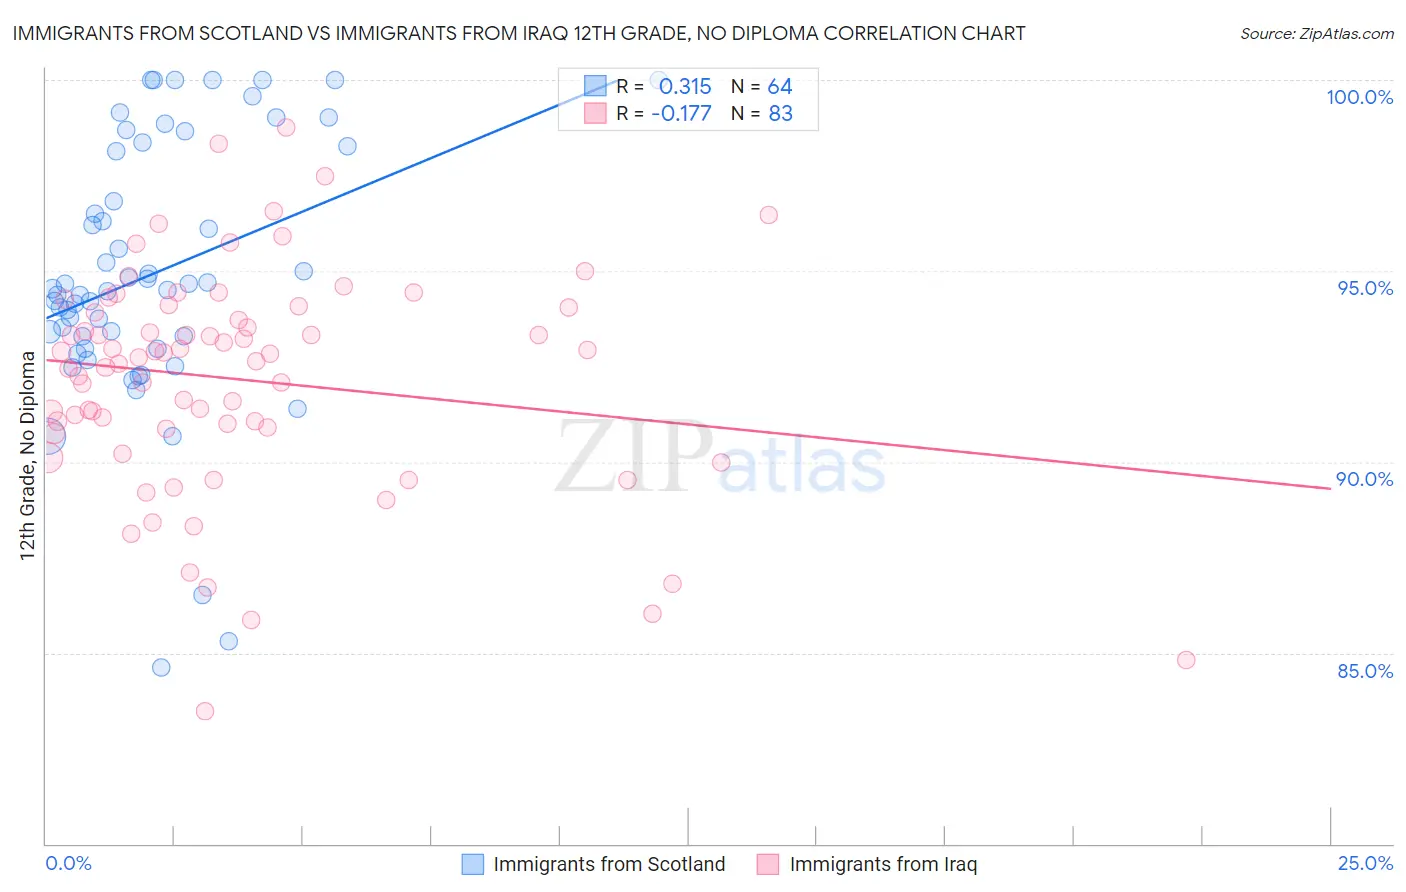
Immigrants from Scotland vs Immigrants from Iraq 12th Grade, No Diploma
COMPARE
Immigrants from Scotland
Immigrants from Iraq
12th Grade, No Diploma
12th Grade, No Diploma Comparison
Immigrants from Scotland
Immigrants from Iraq
93.0%
12TH GRADE, NO DIPLOMA
99.9/ 100
METRIC RATING
33rd/ 347
METRIC RANK
91.4%
12TH GRADE, NO DIPLOMA
73.0/ 100
METRIC RATING
155th/ 347
METRIC RANK
Immigrants from Scotland vs Immigrants from Iraq 12th Grade, No Diploma Correlation Chart
The statistical analysis conducted on geographies consisting of 196,398,887 people shows a mild positive correlation between the proportion of Immigrants from Scotland and percentage of population with at least 12th grade (no diploma) education in the United States with a correlation coefficient (R) of 0.315 and weighted average of 93.0%. Similarly, the statistical analysis conducted on geographies consisting of 194,632,332 people shows a poor negative correlation between the proportion of Immigrants from Iraq and percentage of population with at least 12th grade (no diploma) education in the United States with a correlation coefficient (R) of -0.177 and weighted average of 91.4%, a difference of 1.7%.
12th Grade, No Diploma Correlation Summary
| Measurement | Immigrants from Scotland | Immigrants from Iraq |
| Minimum | 84.6% | 83.5% |
| Maximum | 100.0% | 98.8% |
| Range | 15.4% | 15.3% |
| Mean | 94.9% | 92.2% |
| Median | 94.5% | 92.7% |
| Interquartile 25% (IQ1) | 93.1% | 90.9% |
| Interquartile 75% (IQ3) | 98.2% | 94.1% |
| Interquartile Range (IQR) | 5.1% | 3.2% |
| Standard Deviation (Sample) | 3.4% | 2.9% |
| Standard Deviation (Population) | 3.4% | 2.9% |
Similar Demographics by 12th Grade, No Diploma
Demographics Similar to Immigrants from Scotland by 12th Grade, No Diploma
In terms of 12th grade, no diploma, the demographic groups most similar to Immigrants from Scotland are Okinawan (93.0%, a difference of 0.020%), European (93.1%, a difference of 0.030%), English (93.0%, a difference of 0.030%), Scottish (93.0%, a difference of 0.030%), and Irish (93.0%, a difference of 0.030%).
| Demographics | Rating | Rank | 12th Grade, No Diploma |
| Russians | 99.9 /100 | #26 | Exceptional 93.2% |
| Cypriots | 99.9 /100 | #27 | Exceptional 93.1% |
| Immigrants | Northern Europe | 99.9 /100 | #28 | Exceptional 93.1% |
| Iranians | 99.9 /100 | #29 | Exceptional 93.1% |
| Immigrants | Lithuania | 99.9 /100 | #30 | Exceptional 93.1% |
| Immigrants | Ireland | 99.9 /100 | #31 | Exceptional 93.1% |
| Europeans | 99.9 /100 | #32 | Exceptional 93.1% |
| Immigrants | Scotland | 99.9 /100 | #33 | Exceptional 93.0% |
| Okinawans | 99.9 /100 | #34 | Exceptional 93.0% |
| English | 99.9 /100 | #35 | Exceptional 93.0% |
| Scottish | 99.9 /100 | #36 | Exceptional 93.0% |
| Irish | 99.9 /100 | #37 | Exceptional 93.0% |
| Tlingit-Haida | 99.8 /100 | #38 | Exceptional 93.0% |
| Immigrants | Austria | 99.8 /100 | #39 | Exceptional 93.0% |
| Turks | 99.8 /100 | #40 | Exceptional 93.0% |
Demographics Similar to Immigrants from Iraq by 12th Grade, No Diploma
In terms of 12th grade, no diploma, the demographic groups most similar to Immigrants from Iraq are Immigrants from Kenya (91.5%, a difference of 0.010%), Asian (91.4%, a difference of 0.020%), Iraqi (91.5%, a difference of 0.040%), Immigrants from Pakistan (91.4%, a difference of 0.040%), and Kenyan (91.5%, a difference of 0.070%).
| Demographics | Rating | Rank | 12th Grade, No Diploma |
| Indians (Asian) | 79.4 /100 | #148 | Good 91.5% |
| Ugandans | 79.0 /100 | #149 | Good 91.5% |
| Paraguayans | 78.9 /100 | #150 | Good 91.5% |
| Chippewa | 78.8 /100 | #151 | Good 91.5% |
| Kenyans | 77.4 /100 | #152 | Good 91.5% |
| Iraqis | 75.3 /100 | #153 | Good 91.5% |
| Immigrants | Kenya | 73.9 /100 | #154 | Good 91.5% |
| Immigrants | Iraq | 73.0 /100 | #155 | Good 91.4% |
| Asians | 71.9 /100 | #156 | Good 91.4% |
| Immigrants | Pakistan | 70.7 /100 | #157 | Good 91.4% |
| Immigrants | Northern Africa | 66.2 /100 | #158 | Good 91.4% |
| Laotians | 64.4 /100 | #159 | Good 91.3% |
| Immigrants | Albania | 64.1 /100 | #160 | Good 91.3% |
| Immigrants | Hong Kong | 63.8 /100 | #161 | Good 91.3% |
| Brazilians | 62.0 /100 | #162 | Good 91.3% |