Immigrants from Scotland vs Spaniard 1st Grade
COMPARE
Immigrants from Scotland
Spaniard
1st Grade
1st Grade Comparison
Immigrants from Scotland
Spaniards
98.4%
1ST GRADE
99.8/ 100
METRIC RATING
55th/ 347
METRIC RANK
98.1%
1ST GRADE
91.2/ 100
METRIC RATING
131st/ 347
METRIC RANK
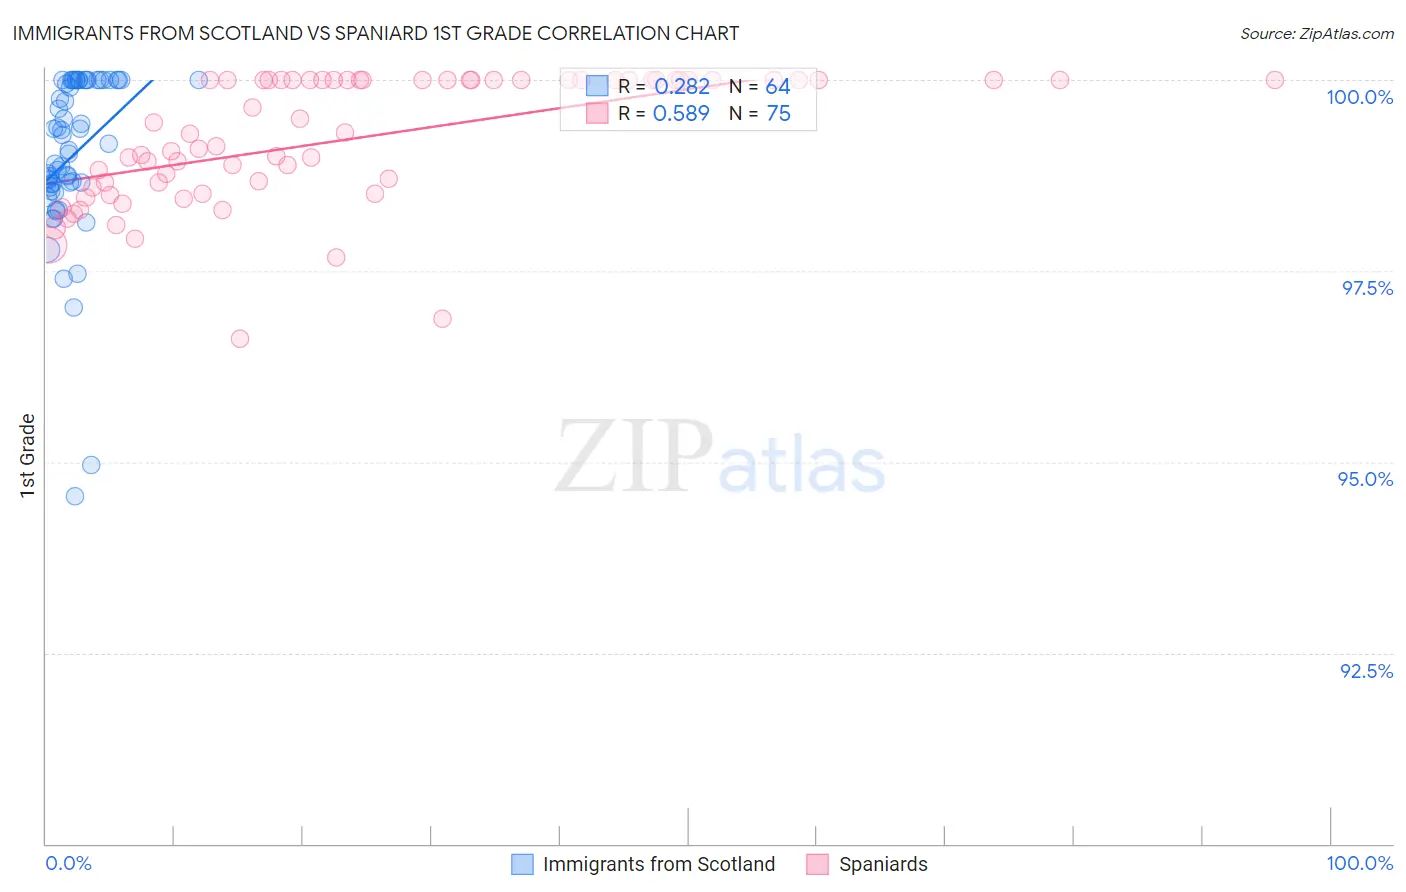
Immigrants from Scotland vs Spaniard 1st Grade Correlation Chart
The statistical analysis conducted on geographies consisting of 196,398,887 people shows a weak positive correlation between the proportion of Immigrants from Scotland and percentage of population with at least 1st grade education in the United States with a correlation coefficient (R) of 0.282 and weighted average of 98.4%. Similarly, the statistical analysis conducted on geographies consisting of 443,544,503 people shows a substantial positive correlation between the proportion of Spaniards and percentage of population with at least 1st grade education in the United States with a correlation coefficient (R) of 0.589 and weighted average of 98.1%, a difference of 0.30%.
1st Grade Correlation Summary
| Measurement | Immigrants from Scotland | Spaniard |
| Minimum | 94.6% | 96.6% |
| Maximum | 100.0% | 100.0% |
| Range | 5.4% | 3.4% |
| Mean | 99.0% | 99.2% |
| Median | 99.1% | 99.3% |
| Interquartile 25% (IQ1) | 98.6% | 98.6% |
| Interquartile 75% (IQ3) | 100.0% | 100.0% |
| Interquartile Range (IQR) | 1.4% | 1.4% |
| Standard Deviation (Sample) | 1.1% | 0.84% |
| Standard Deviation (Population) | 1.1% | 0.84% |
Similar Demographics by 1st Grade
Demographics Similar to Immigrants from Scotland by 1st Grade
In terms of 1st grade, the demographic groups most similar to Immigrants from Scotland are Pueblo (98.4%, a difference of 0.010%), Kiowa (98.4%, a difference of 0.010%), Australian (98.4%, a difference of 0.010%), American (98.4%, a difference of 0.010%), and Austrian (98.4%, a difference of 0.010%).
| Demographics | Rating | Rank | 1st Grade |
| Czechoslovakians | 99.8 /100 | #48 | Exceptional 98.4% |
| Celtics | 99.8 /100 | #49 | Exceptional 98.4% |
| Whites/Caucasians | 99.8 /100 | #50 | Exceptional 98.4% |
| Estonians | 99.8 /100 | #51 | Exceptional 98.4% |
| Pueblo | 99.8 /100 | #52 | Exceptional 98.4% |
| Kiowa | 99.8 /100 | #53 | Exceptional 98.4% |
| Australians | 99.8 /100 | #54 | Exceptional 98.4% |
| Immigrants | Scotland | 99.8 /100 | #55 | Exceptional 98.4% |
| Americans | 99.8 /100 | #56 | Exceptional 98.4% |
| Austrians | 99.8 /100 | #57 | Exceptional 98.4% |
| New Zealanders | 99.7 /100 | #58 | Exceptional 98.4% |
| Creek | 99.7 /100 | #59 | Exceptional 98.4% |
| Immigrants | Canada | 99.7 /100 | #60 | Exceptional 98.4% |
| Bulgarians | 99.7 /100 | #61 | Exceptional 98.4% |
| Slavs | 99.7 /100 | #62 | Exceptional 98.4% |
Demographics Similar to Spaniards by 1st Grade
In terms of 1st grade, the demographic groups most similar to Spaniards are Immigrants from Croatia (98.1%, a difference of 0.0%), Cambodian (98.1%, a difference of 0.0%), Immigrants from Serbia (98.1%, a difference of 0.010%), Seminole (98.1%, a difference of 0.010%), and Immigrants from Europe (98.1%, a difference of 0.010%).
| Demographics | Rating | Rank | 1st Grade |
| Syrians | 93.7 /100 | #124 | Exceptional 98.1% |
| Immigrants | Japan | 93.7 /100 | #125 | Exceptional 98.1% |
| Lebanese | 93.5 /100 | #126 | Exceptional 98.1% |
| Immigrants | Saudi Arabia | 93.3 /100 | #127 | Exceptional 98.1% |
| Immigrants | Serbia | 92.2 /100 | #128 | Exceptional 98.1% |
| Seminole | 91.9 /100 | #129 | Exceptional 98.1% |
| Immigrants | Croatia | 91.4 /100 | #130 | Exceptional 98.1% |
| Spaniards | 91.2 /100 | #131 | Exceptional 98.1% |
| Cambodians | 90.9 /100 | #132 | Exceptional 98.1% |
| Immigrants | Europe | 90.5 /100 | #133 | Exceptional 98.1% |
| Immigrants | Hungary | 89.4 /100 | #134 | Excellent 98.1% |
| Immigrants | Kuwait | 89.3 /100 | #135 | Excellent 98.1% |
| Immigrants | Bulgaria | 88.8 /100 | #136 | Excellent 98.1% |
| Israelis | 87.8 /100 | #137 | Excellent 98.1% |
| Immigrants | Romania | 87.8 /100 | #138 | Excellent 98.1% |