Immigrants from Saudi Arabia vs Colville 9th Grade
COMPARE
Immigrants from Saudi Arabia
Colville
9th Grade
9th Grade Comparison
Immigrants from Saudi Arabia
Colville
95.6%
9TH GRADE
98.8/ 100
METRIC RATING
92nd/ 347
METRIC RANK
94.9%
9TH GRADE
58.5/ 100
METRIC RATING
171st/ 347
METRIC RANK
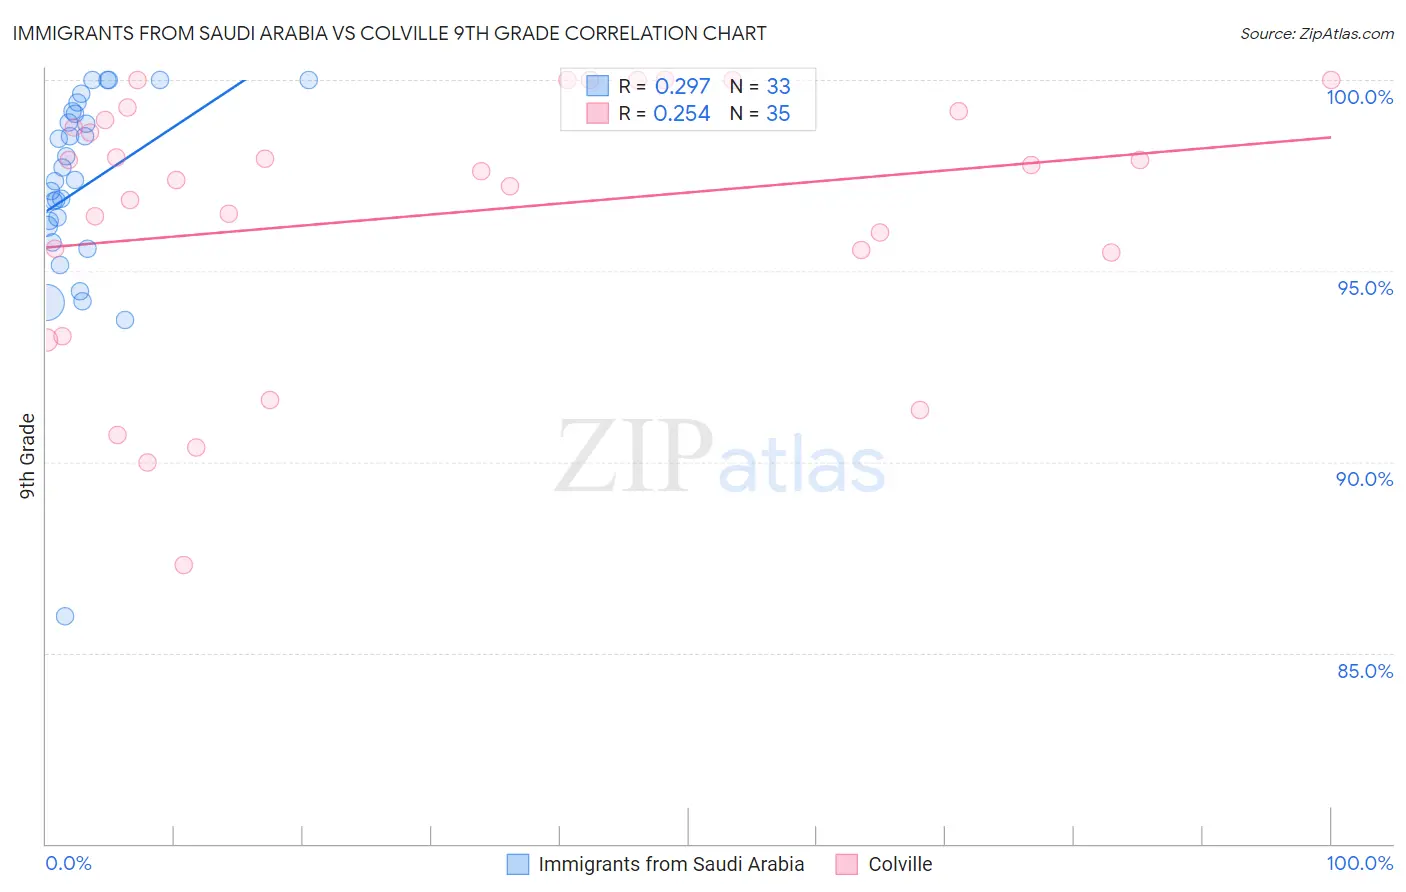
Immigrants from Saudi Arabia vs Colville 9th Grade Correlation Chart
The statistical analysis conducted on geographies consisting of 164,277,573 people shows a weak positive correlation between the proportion of Immigrants from Saudi Arabia and percentage of population with at least 9th grade education in the United States with a correlation coefficient (R) of 0.297 and weighted average of 95.6%. Similarly, the statistical analysis conducted on geographies consisting of 34,682,094 people shows a weak positive correlation between the proportion of Colville and percentage of population with at least 9th grade education in the United States with a correlation coefficient (R) of 0.254 and weighted average of 94.9%, a difference of 0.74%.
9th Grade Correlation Summary
| Measurement | Immigrants from Saudi Arabia | Colville |
| Minimum | 85.9% | 87.3% |
| Maximum | 100.0% | 100.0% |
| Range | 14.1% | 12.7% |
| Mean | 97.2% | 96.5% |
| Median | 97.4% | 97.6% |
| Interquartile 25% (IQ1) | 96.0% | 95.5% |
| Interquartile 75% (IQ3) | 99.1% | 99.2% |
| Interquartile Range (IQR) | 3.2% | 3.7% |
| Standard Deviation (Sample) | 2.8% | 3.4% |
| Standard Deviation (Population) | 2.7% | 3.4% |
Similar Demographics by 9th Grade
Demographics Similar to Immigrants from Saudi Arabia by 9th Grade
In terms of 9th grade, the demographic groups most similar to Immigrants from Saudi Arabia are Creek (95.6%, a difference of 0.0%), South African (95.6%, a difference of 0.010%), Immigrants from Germany (95.6%, a difference of 0.010%), Immigrants from Latvia (95.6%, a difference of 0.010%), and Immigrants from Czechoslovakia (95.7%, a difference of 0.020%).
| Demographics | Rating | Rank | 9th Grade |
| Icelanders | 99.1 /100 | #85 | Exceptional 95.7% |
| Immigrants | Western Europe | 99.1 /100 | #86 | Exceptional 95.7% |
| Okinawans | 99.0 /100 | #87 | Exceptional 95.7% |
| Immigrants | Czechoslovakia | 98.9 /100 | #88 | Exceptional 95.7% |
| Yugoslavians | 98.9 /100 | #89 | Exceptional 95.7% |
| South Africans | 98.8 /100 | #90 | Exceptional 95.6% |
| Creek | 98.8 /100 | #91 | Exceptional 95.6% |
| Immigrants | Saudi Arabia | 98.8 /100 | #92 | Exceptional 95.6% |
| Immigrants | Germany | 98.7 /100 | #93 | Exceptional 95.6% |
| Immigrants | Latvia | 98.7 /100 | #94 | Exceptional 95.6% |
| Americans | 98.5 /100 | #95 | Exceptional 95.6% |
| Filipinos | 98.5 /100 | #96 | Exceptional 95.6% |
| Delaware | 98.4 /100 | #97 | Exceptional 95.6% |
| Immigrants | Japan | 98.4 /100 | #98 | Exceptional 95.6% |
| Menominee | 98.3 /100 | #99 | Exceptional 95.6% |
Demographics Similar to Colville by 9th Grade
In terms of 9th grade, the demographic groups most similar to Colville are Alsatian (94.9%, a difference of 0.0%), Spaniard (94.9%, a difference of 0.010%), Immigrants from Brazil (95.0%, a difference of 0.020%), Chilean (95.0%, a difference of 0.020%), and Blackfeet (95.0%, a difference of 0.030%).
| Demographics | Rating | Rank | 9th Grade |
| Venezuelans | 63.6 /100 | #164 | Good 95.0% |
| Blackfeet | 62.6 /100 | #165 | Good 95.0% |
| Ute | 62.6 /100 | #166 | Good 95.0% |
| Immigrants | Brazil | 61.1 /100 | #167 | Good 95.0% |
| Chileans | 60.7 /100 | #168 | Good 95.0% |
| Spaniards | 59.6 /100 | #169 | Average 94.9% |
| Alsatians | 58.6 /100 | #170 | Average 94.9% |
| Colville | 58.5 /100 | #171 | Average 94.9% |
| Iraqis | 54.0 /100 | #172 | Average 94.9% |
| Cheyenne | 51.5 /100 | #173 | Average 94.9% |
| Immigrants | Egypt | 50.0 /100 | #174 | Average 94.9% |
| Brazilians | 49.8 /100 | #175 | Average 94.9% |
| Immigrants | Spain | 49.1 /100 | #176 | Average 94.9% |
| Immigrants | Iraq | 47.8 /100 | #177 | Average 94.9% |
| Immigrants | Poland | 46.7 /100 | #178 | Average 94.9% |