Immigrants from Cameroon vs Colville 9th Grade
COMPARE
Immigrants from Cameroon
Colville
9th Grade
9th Grade Comparison
Immigrants from Cameroon
Colville
94.2%
9TH GRADE
2.1/ 100
METRIC RATING
243rd/ 347
METRIC RANK
94.9%
9TH GRADE
58.5/ 100
METRIC RATING
171st/ 347
METRIC RANK
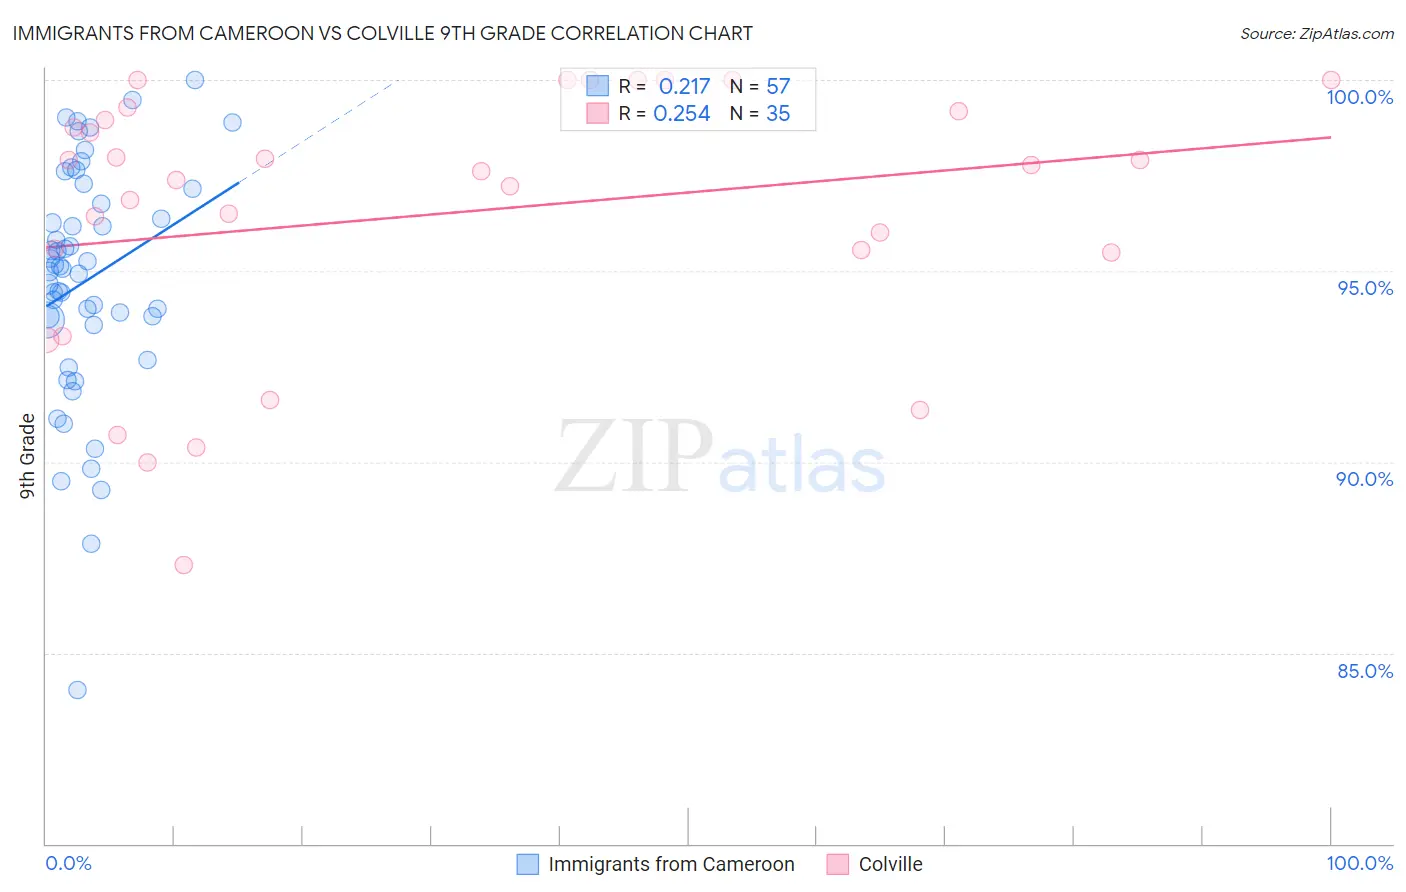
Immigrants from Cameroon vs Colville 9th Grade Correlation Chart
The statistical analysis conducted on geographies consisting of 130,618,704 people shows a weak positive correlation between the proportion of Immigrants from Cameroon and percentage of population with at least 9th grade education in the United States with a correlation coefficient (R) of 0.217 and weighted average of 94.2%. Similarly, the statistical analysis conducted on geographies consisting of 34,682,094 people shows a weak positive correlation between the proportion of Colville and percentage of population with at least 9th grade education in the United States with a correlation coefficient (R) of 0.254 and weighted average of 94.9%, a difference of 0.77%.
9th Grade Correlation Summary
| Measurement | Immigrants from Cameroon | Colville |
| Minimum | 84.0% | 87.3% |
| Maximum | 100.0% | 100.0% |
| Range | 16.0% | 12.7% |
| Mean | 94.7% | 96.5% |
| Median | 95.1% | 97.6% |
| Interquartile 25% (IQ1) | 93.7% | 95.5% |
| Interquartile 75% (IQ3) | 97.0% | 99.2% |
| Interquartile Range (IQR) | 3.3% | 3.7% |
| Standard Deviation (Sample) | 3.1% | 3.4% |
| Standard Deviation (Population) | 3.1% | 3.4% |
Similar Demographics by 9th Grade
Demographics Similar to Immigrants from Cameroon by 9th Grade
In terms of 9th grade, the demographic groups most similar to Immigrants from Cameroon are Immigrants from Middle Africa (94.2%, a difference of 0.0%), Dutch West Indian (94.2%, a difference of 0.010%), Paiute (94.2%, a difference of 0.020%), Senegalese (94.2%, a difference of 0.020%), and Afghan (94.2%, a difference of 0.030%).
| Demographics | Rating | Rank | 9th Grade |
| Somalis | 2.9 /100 | #236 | Tragic 94.3% |
| Koreans | 2.9 /100 | #237 | Tragic 94.3% |
| South American Indians | 2.8 /100 | #238 | Tragic 94.3% |
| Immigrants | China | 2.8 /100 | #239 | Tragic 94.3% |
| Immigrants | Ethiopia | 2.7 /100 | #240 | Tragic 94.3% |
| Spanish Americans | 2.6 /100 | #241 | Tragic 94.2% |
| Immigrants | Middle Africa | 2.2 /100 | #242 | Tragic 94.2% |
| Immigrants | Cameroon | 2.1 /100 | #243 | Tragic 94.2% |
| Dutch West Indians | 2.0 /100 | #244 | Tragic 94.2% |
| Paiute | 1.9 /100 | #245 | Tragic 94.2% |
| Senegalese | 1.9 /100 | #246 | Tragic 94.2% |
| Afghans | 1.8 /100 | #247 | Tragic 94.2% |
| Immigrants | Somalia | 1.4 /100 | #248 | Tragic 94.1% |
| Uruguayans | 1.3 /100 | #249 | Tragic 94.1% |
| Immigrants | Hong Kong | 1.3 /100 | #250 | Tragic 94.1% |
Demographics Similar to Colville by 9th Grade
In terms of 9th grade, the demographic groups most similar to Colville are Alsatian (94.9%, a difference of 0.0%), Spaniard (94.9%, a difference of 0.010%), Immigrants from Brazil (95.0%, a difference of 0.020%), Chilean (95.0%, a difference of 0.020%), and Blackfeet (95.0%, a difference of 0.030%).
| Demographics | Rating | Rank | 9th Grade |
| Venezuelans | 63.6 /100 | #164 | Good 95.0% |
| Blackfeet | 62.6 /100 | #165 | Good 95.0% |
| Ute | 62.6 /100 | #166 | Good 95.0% |
| Immigrants | Brazil | 61.1 /100 | #167 | Good 95.0% |
| Chileans | 60.7 /100 | #168 | Good 95.0% |
| Spaniards | 59.6 /100 | #169 | Average 94.9% |
| Alsatians | 58.6 /100 | #170 | Average 94.9% |
| Colville | 58.5 /100 | #171 | Average 94.9% |
| Iraqis | 54.0 /100 | #172 | Average 94.9% |
| Cheyenne | 51.5 /100 | #173 | Average 94.9% |
| Immigrants | Egypt | 50.0 /100 | #174 | Average 94.9% |
| Brazilians | 49.8 /100 | #175 | Average 94.9% |
| Immigrants | Spain | 49.1 /100 | #176 | Average 94.9% |
| Immigrants | Iraq | 47.8 /100 | #177 | Average 94.9% |
| Immigrants | Poland | 46.7 /100 | #178 | Average 94.9% |