Immigrants from Russia vs Kenyan Nursery School
COMPARE
Immigrants from Russia
Kenyan
Nursery School
Nursery School Comparison
Immigrants from Russia
Kenyans
98.0%
NURSERY SCHOOL
59.9/ 100
METRIC RATING
160th/ 347
METRIC RANK
98.0%
NURSERY SCHOOL
50.2/ 100
METRIC RATING
173rd/ 347
METRIC RANK
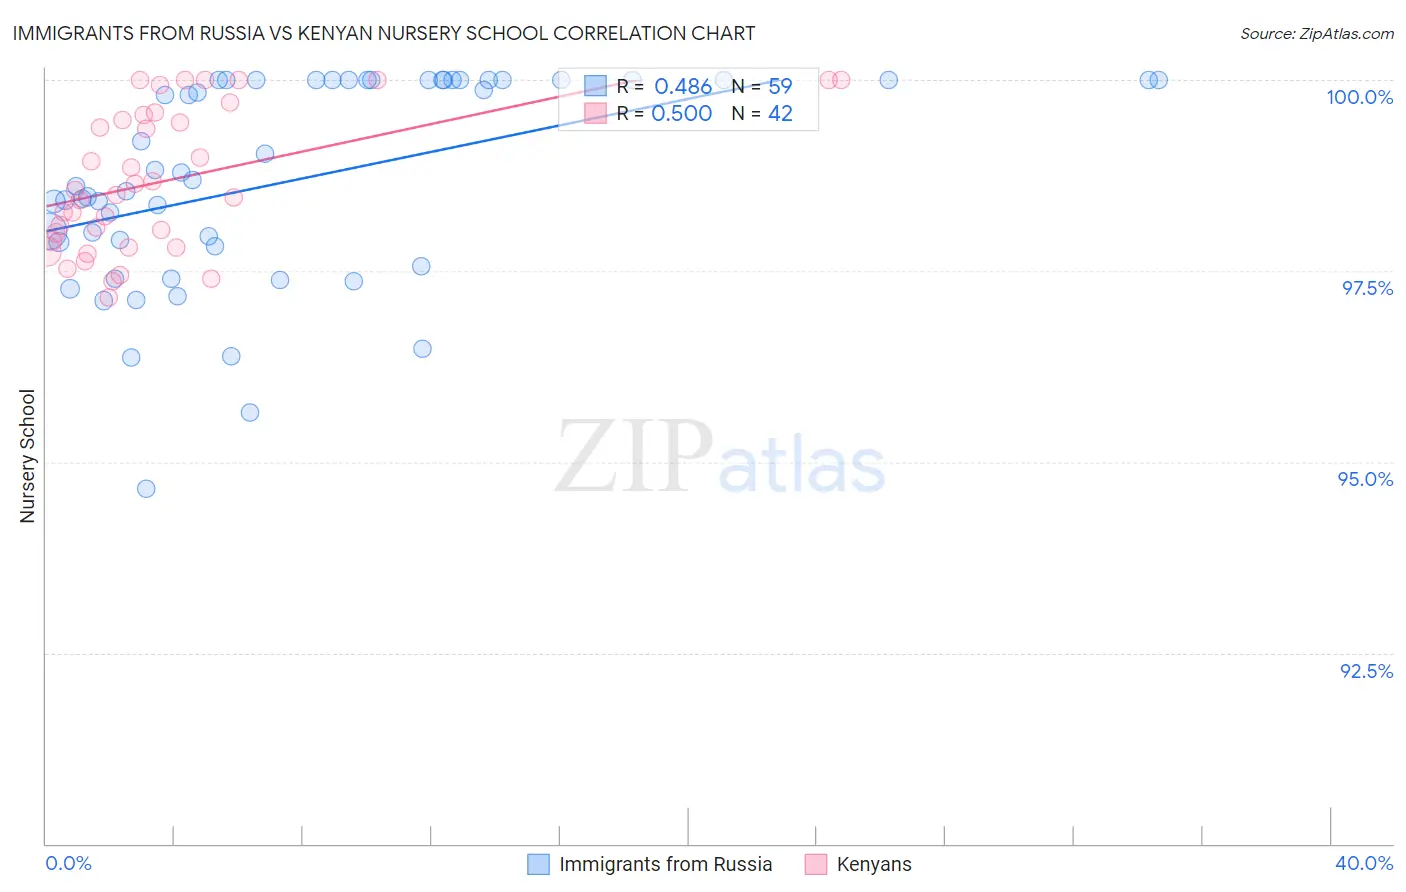
Immigrants from Russia vs Kenyan Nursery School Correlation Chart
The statistical analysis conducted on geographies consisting of 347,948,494 people shows a moderate positive correlation between the proportion of Immigrants from Russia and percentage of population with at least nursery school education in the United States with a correlation coefficient (R) of 0.486 and weighted average of 98.0%. Similarly, the statistical analysis conducted on geographies consisting of 168,244,481 people shows a substantial positive correlation between the proportion of Kenyans and percentage of population with at least nursery school education in the United States with a correlation coefficient (R) of 0.500 and weighted average of 98.0%, a difference of 0.030%.
Nursery School Correlation Summary
| Measurement | Immigrants from Russia | Kenyan |
| Minimum | 94.6% | 97.2% |
| Maximum | 100.0% | 100.0% |
| Range | 5.4% | 2.8% |
| Mean | 98.7% | 98.7% |
| Median | 98.7% | 98.5% |
| Interquartile 25% (IQ1) | 97.8% | 97.9% |
| Interquartile 75% (IQ3) | 100.0% | 99.5% |
| Interquartile Range (IQR) | 2.2% | 1.6% |
| Standard Deviation (Sample) | 1.3% | 0.92% |
| Standard Deviation (Population) | 1.3% | 0.91% |
Demographics Similar to Immigrants from Russia and Kenyans by Nursery School
In terms of nursery school, the demographic groups most similar to Immigrants from Russia are Immigrants from Eastern Europe (98.0%, a difference of 0.0%), Brazilian (98.0%, a difference of 0.0%), Immigrants from Italy (98.0%, a difference of 0.0%), French American Indian (98.0%, a difference of 0.010%), and Ugandan (98.0%, a difference of 0.010%). Similarly, the demographic groups most similar to Kenyans are Immigrants from Brazil (98.0%, a difference of 0.0%), Navajo (98.0%, a difference of 0.0%), Immigrants from Sri Lanka (98.0%, a difference of 0.0%), Immigrants from Venezuela (98.0%, a difference of 0.0%), and Immigrants from Micronesia (98.0%, a difference of 0.010%).
| Demographics | Rating | Rank | Nursery School |
| Venezuelans | 66.6 /100 | #156 | Good 98.0% |
| Comanche | 66.0 /100 | #157 | Good 98.0% |
| Immigrants | North Macedonia | 65.7 /100 | #158 | Good 98.0% |
| French American Indians | 62.1 /100 | #159 | Good 98.0% |
| Immigrants | Russia | 59.9 /100 | #160 | Average 98.0% |
| Immigrants | Eastern Europe | 59.7 /100 | #161 | Average 98.0% |
| Brazilians | 59.4 /100 | #162 | Average 98.0% |
| Immigrants | Italy | 59.0 /100 | #163 | Average 98.0% |
| Ugandans | 56.4 /100 | #164 | Average 98.0% |
| Chileans | 56.4 /100 | #165 | Average 98.0% |
| Spanish Americans | 55.6 /100 | #166 | Average 98.0% |
| Immigrants | Spain | 55.6 /100 | #167 | Average 98.0% |
| Immigrants | Micronesia | 55.0 /100 | #168 | Average 98.0% |
| Immigrants | Korea | 53.8 /100 | #169 | Average 98.0% |
| Bermudans | 53.7 /100 | #170 | Average 98.0% |
| Immigrants | Jordan | 53.4 /100 | #171 | Average 98.0% |
| Immigrants | Brazil | 51.3 /100 | #172 | Average 98.0% |
| Kenyans | 50.2 /100 | #173 | Average 98.0% |
| Navajo | 50.0 /100 | #174 | Average 98.0% |
| Immigrants | Sri Lanka | 49.9 /100 | #175 | Average 98.0% |
| Immigrants | Venezuela | 49.8 /100 | #176 | Average 98.0% |