Immigrants from Romania vs Immigrants from Europe Disability Age 18 to 34
COMPARE
Immigrants from Romania
Immigrants from Europe
Disability Age 18 to 34
Disability Age 18 to 34 Comparison
Immigrants from Romania
Immigrants from Europe
6.3%
DISABILITY AGE 18 TO 34
94.9/ 100
METRIC RATING
112th/ 347
METRIC RANK
6.4%
DISABILITY AGE 18 TO 34
88.8/ 100
METRIC RATING
134th/ 347
METRIC RANK
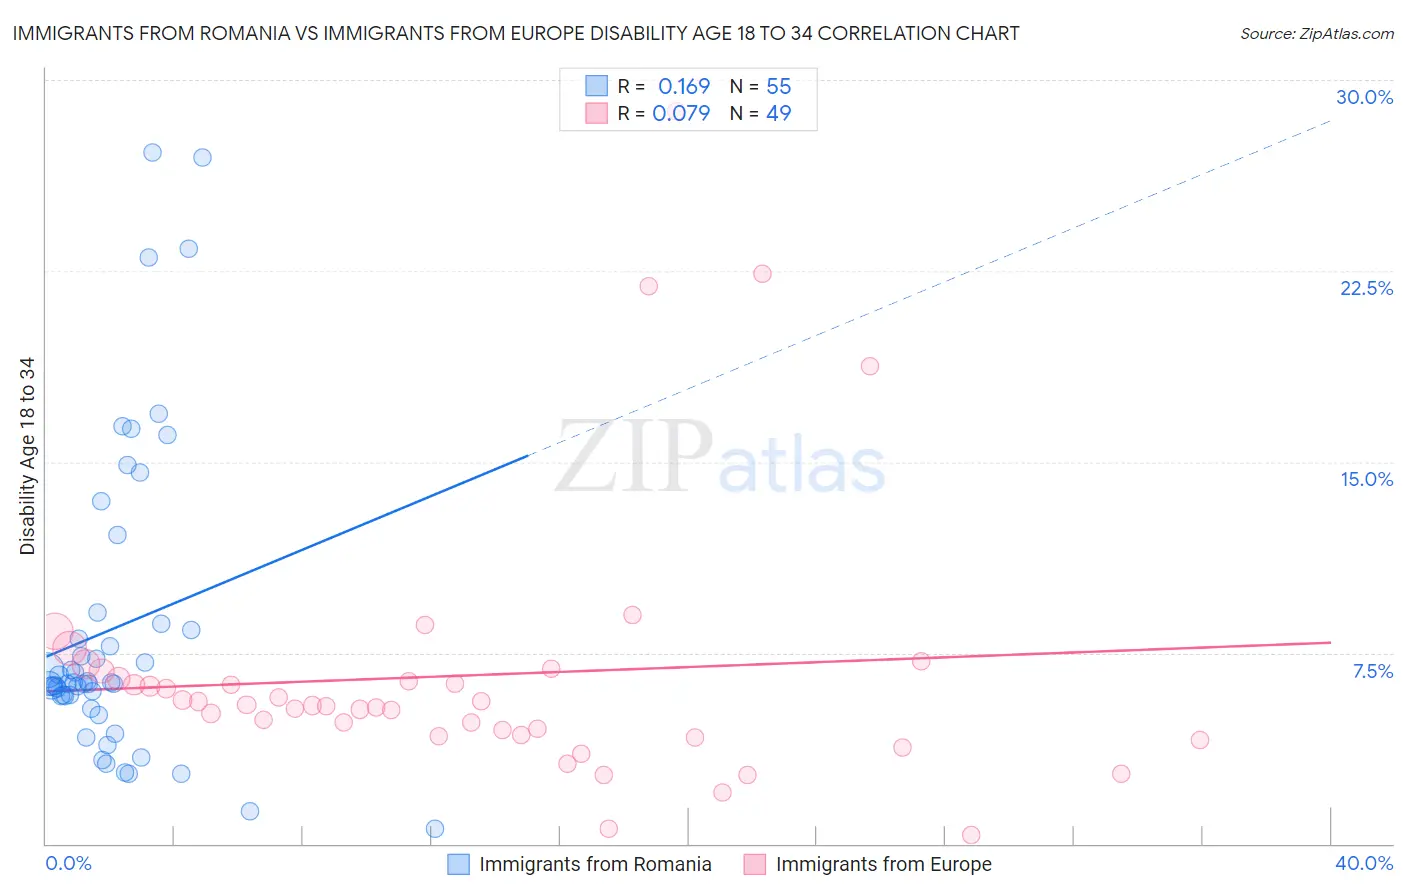
Immigrants from Romania vs Immigrants from Europe Disability Age 18 to 34 Correlation Chart
The statistical analysis conducted on geographies consisting of 256,653,302 people shows a poor positive correlation between the proportion of Immigrants from Romania and percentage of population with a disability between the ages 18 and 35 in the United States with a correlation coefficient (R) of 0.169 and weighted average of 6.3%. Similarly, the statistical analysis conducted on geographies consisting of 543,483,313 people shows a slight positive correlation between the proportion of Immigrants from Europe and percentage of population with a disability between the ages 18 and 35 in the United States with a correlation coefficient (R) of 0.079 and weighted average of 6.4%, a difference of 1.6%.
Disability Age 18 to 34 Correlation Summary
| Measurement | Immigrants from Romania | Immigrants from Europe |
| Minimum | 0.58% | 0.33% |
| Maximum | 27.1% | 28.8% |
| Range | 26.6% | 28.5% |
| Mean | 8.5% | 6.6% |
| Median | 6.3% | 5.4% |
| Interquartile 25% (IQ1) | 5.8% | 4.2% |
| Interquartile 75% (IQ3) | 8.6% | 6.6% |
| Interquartile Range (IQR) | 2.8% | 2.4% |
| Standard Deviation (Sample) | 6.1% | 5.3% |
| Standard Deviation (Population) | 6.0% | 5.3% |
Similar Demographics by Disability Age 18 to 34
Demographics Similar to Immigrants from Romania by Disability Age 18 to 34
In terms of disability age 18 to 34, the demographic groups most similar to Immigrants from Romania are Immigrants from Latin America (6.3%, a difference of 0.0%), Immigrants from France (6.3%, a difference of 0.090%), Immigrants from Brazil (6.3%, a difference of 0.10%), Immigrants from South Eastern Asia (6.3%, a difference of 0.18%), and Sri Lankan (6.2%, a difference of 0.25%).
| Demographics | Rating | Rank | Disability Age 18 to 34 |
| Bhutanese | 96.2 /100 | #105 | Exceptional 6.2% |
| Immigrants | Afghanistan | 95.9 /100 | #106 | Exceptional 6.2% |
| Ethiopians | 95.8 /100 | #107 | Exceptional 6.2% |
| Immigrants | Croatia | 95.7 /100 | #108 | Exceptional 6.2% |
| Sri Lankans | 95.5 /100 | #109 | Exceptional 6.2% |
| Immigrants | Brazil | 95.2 /100 | #110 | Exceptional 6.3% |
| Immigrants | France | 95.1 /100 | #111 | Exceptional 6.3% |
| Immigrants | Romania | 94.9 /100 | #112 | Exceptional 6.3% |
| Immigrants | Latin America | 94.9 /100 | #113 | Exceptional 6.3% |
| Immigrants | South Eastern Asia | 94.4 /100 | #114 | Exceptional 6.3% |
| Koreans | 94.1 /100 | #115 | Exceptional 6.3% |
| Immigrants | Costa Rica | 94.0 /100 | #116 | Exceptional 6.3% |
| Immigrants | Jordan | 94.0 /100 | #117 | Exceptional 6.3% |
| Immigrants | Nepal | 93.7 /100 | #118 | Exceptional 6.3% |
| Chileans | 93.5 /100 | #119 | Exceptional 6.3% |
Demographics Similar to Immigrants from Europe by Disability Age 18 to 34
In terms of disability age 18 to 34, the demographic groups most similar to Immigrants from Europe are Brazilian (6.4%, a difference of 0.030%), Palestinian (6.4%, a difference of 0.040%), Immigrants from Sweden (6.4%, a difference of 0.050%), Guatemalan (6.4%, a difference of 0.15%), and Immigrants from Honduras (6.4%, a difference of 0.18%).
| Demographics | Rating | Rank | Disability Age 18 to 34 |
| West Indians | 92.0 /100 | #127 | Exceptional 6.3% |
| Chinese | 91.9 /100 | #128 | Exceptional 6.3% |
| Immigrants | Italy | 90.5 /100 | #129 | Exceptional 6.3% |
| Immigrants | Dominica | 90.5 /100 | #130 | Exceptional 6.3% |
| Immigrants | Saudi Arabia | 90.4 /100 | #131 | Exceptional 6.3% |
| Guatemalans | 89.6 /100 | #132 | Excellent 6.4% |
| Brazilians | 89.0 /100 | #133 | Excellent 6.4% |
| Immigrants | Europe | 88.8 /100 | #134 | Excellent 6.4% |
| Palestinians | 88.5 /100 | #135 | Excellent 6.4% |
| Immigrants | Sweden | 88.5 /100 | #136 | Excellent 6.4% |
| Immigrants | Honduras | 87.7 /100 | #137 | Excellent 6.4% |
| Spanish American Indians | 87.7 /100 | #138 | Excellent 6.4% |
| Immigrants | Belize | 87.4 /100 | #139 | Excellent 6.4% |
| Immigrants | Fiji | 87.3 /100 | #140 | Excellent 6.4% |
| Jamaicans | 86.8 /100 | #141 | Excellent 6.4% |