Colombian vs Nepalese High School Diploma

COMPARE

Colombian
Race
Ancestry
AfghanAfricanAlaska NativeAlaskan AthabascanAlbanianAleutAlsatianAmericanApacheArabArapahoArgentineanArmenianAssyrian/Chaldean/SyriacAustralianAustrianBahamianBangladeshiBarbadianBasqueBelgianBelizeanBermudanBhutaneseBlackfeetBolivianBrazilianBritishBritish West IndianBulgarianBurmeseCajunCambodianCanadianCape VerdeanCarpatho RusynCelticCentral AmericanCentral American IndianCherokeeCheyenneChickasawChileanChineseChippewaChoctawColombianColvilleComancheCosta RicanCreeCreekCroatianCrowCubanCypriotCzechCzechoslovakianDanishDelawareDominicanDutchDutch West IndianEastern EuropeanEcuadorianEgyptianEnglishEstonianEthiopianEuropeanFijianFilipinoFinnishFrenchFrench American IndianFrench CanadianGermanGerman RussianGhanaianGreekGuamanian/ChamorroGuatemalanGuyaneseHaitianHmongHonduranHopiHoumaHungarianIcelanderIndian (Asian)IndonesianInupiatIranianIraqiIrishIroquoisIsraeliItalianJamaicanJapaneseJordanianKenyanKiowaKoreanLaotianLatvianLebaneseLiberianLithuanianLumbeeLuxembourgerMacedonianMalaysianMalteseMarshalleseMenomineeMexicanMexican American IndianMongolianMoroccanNative HawaiianNavajoNew ZealanderNicaraguanNigerianNorthern EuropeanNorwegianOkinawanOsageOttawaPaiutePakistaniPalestinianPanamanianParaguayanPennsylvania GermanPeruvianPimaPolishPortuguesePotawatomiPuebloPuerto RicanPuget Sound SalishRomanianRussianSalvadoranSamoanScandinavianScotch-IrishScottishSeminoleSenegaleseSerbianShoshoneSierra LeoneanSiouxSlavicSlovakSloveneSomaliSouth AfricanSouth AmericanSouth American IndianSoviet UnionSpaniardSpanishSpanish AmericanSpanish American IndianSri LankanSubsaharan AfricanSudaneseSwedishSwissSyrianTaiwaneseThaiTlingit-HaidaTohono O'OdhamTonganTrinidadian and TobagonianTsimshianTurkishU.S. Virgin IslanderUgandanUkrainianUruguayanUteVenezuelanVietnameseWelshWest IndianYakamaYaquiYugoslavianYumanYup'ikZimbabwean
Immigration
NonimmigrantsImmigrantsAfghanistanAfricaAlbaniaArgentinaArmeniaAsiaAustraliaAustriaBahamasBangladeshBarbadosBelarusBelgiumBelizeBoliviaBosnia and HerzegovinaBrazilBulgariaBurma/MyanmarCabo VerdeCambodiaCameroonCanadaCaribbeanCentral AmericaChileChinaColombiaCongoCosta RicaCroatiaCubaCzechoslovakiaDenmarkDominicaDominican RepublicEastern AfricaEastern AsiaEastern EuropeEcuadorEgyptEl SalvadorEnglandEritreaEthiopiaEuropeFijiFranceGermanyGhanaGreeceGrenadaGuatemalaGuyanaHaitiHondurasHong KongHungaryIndiaIndonesiaIranIraqIrelandIsraelItalyJamaicaJapanJordanKazakhstanKenyaKoreaKuwaitLaosLatin AmericaLatviaLebanonLiberiaLithuaniaMalaysiaMexicoMicronesiaMiddle AfricaMoldovaMoroccoNepalNetherlandsNicaraguaNigeriaNorth AmericaNorth MacedoniaNorthern AfricaNorthern EuropeNorwayOceaniaPakistanPanamaPeruPhilippinesPolandPortugalRomaniaRussiaSaudi ArabiaScotlandSenegalSerbiaSierra LeoneSingaporeSomaliaSouth AfricaSouth AmericaSouth Central AsiaSouth Eastern AsiaSouthern EuropeSpainSri LankaSt. Vincent and the GrenadinesSudanSwedenSwitzerlandSyriaTaiwanThailandTrinidad and TobagoTurkeyUgandaUkraineUruguayUzbekistanVenezuelaVietnamWest IndiesWestern AfricaWestern AsiaWestern EuropeYemenZaireZimbabweAzores
Nepalese
Race
Ancestry
AfghanAfricanAlaska NativeAlaskan AthabascanAlbanianAleutAlsatianAmericanApacheArabArapahoArgentineanArmenianAssyrian/Chaldean/SyriacAustralianAustrianBahamianBangladeshiBarbadianBasqueBelgianBelizeanBermudanBhutaneseBlackfeetBolivianBrazilianBritishBritish West IndianBulgarianBurmeseCajunCambodianCanadianCape VerdeanCarpatho RusynCelticCentral AmericanCentral American IndianCherokeeCheyenneChickasawChileanChineseChippewaChoctawColvilleComancheCosta RicanCreeCreekCroatianCrowCubanCypriotCzechCzechoslovakianDanishDelawareDominicanDutchDutch West IndianEastern EuropeanEcuadorianEgyptianEnglishEstonianEthiopianEuropeanFijianFilipinoFinnishFrenchFrench American IndianFrench CanadianGermanGerman RussianGhanaianGreekGuamanian/ChamorroGuatemalanGuyaneseHaitianHmongHonduranHopiHoumaHungarianIcelanderIndian (Asian)IndonesianInupiatIranianIraqiIrishIroquoisIsraeliItalianJamaicanJapaneseJordanianKenyanKiowaKoreanLaotianLatvianLebaneseLiberianLithuanianLumbeeLuxembourgerMacedonianMalaysianMalteseMarshalleseMenomineeMexicanMexican American IndianMongolianMoroccanNative HawaiianNavajoNepaleseNew ZealanderNicaraguanNigerianNorthern EuropeanNorwegianOkinawanOsageOttawaPaiutePakistaniPalestinianPanamanianParaguayanPennsylvania GermanPeruvianPimaPolishPortuguesePotawatomiPuebloPuerto RicanPuget Sound SalishRomanianRussianSalvadoranSamoanScandinavianScotch-IrishScottishSeminoleSenegaleseSerbianShoshoneSierra LeoneanSiouxSlavicSlovakSloveneSomaliSouth AfricanSouth AmericanSouth American IndianSoviet UnionSpaniardSpanishSpanish AmericanSpanish American IndianSri LankanSubsaharan AfricanSudaneseSwedishSwissSyrianTaiwaneseThaiTlingit-HaidaTohono O'OdhamTonganTrinidadian and TobagonianTsimshianTurkishU.S. Virgin IslanderUgandanUkrainianUruguayanUteVenezuelanVietnameseWelshWest IndianYakamaYaquiYugoslavianYumanYup'ikZimbabwean
Immigration
NonimmigrantsImmigrantsAfghanistanAfricaAlbaniaArgentinaArmeniaAsiaAustraliaAustriaBahamasBangladeshBarbadosBelarusBelgiumBelizeBoliviaBosnia and HerzegovinaBrazilBulgariaBurma/MyanmarCabo VerdeCambodiaCameroonCanadaCaribbeanCentral AmericaChileChinaColombiaCongoCosta RicaCroatiaCubaCzechoslovakiaDenmarkDominicaDominican RepublicEastern AfricaEastern AsiaEastern EuropeEcuadorEgyptEl SalvadorEnglandEritreaEthiopiaEuropeFijiFranceGermanyGhanaGreeceGrenadaGuatemalaGuyanaHaitiHondurasHong KongHungaryIndiaIndonesiaIranIraqIrelandIsraelItalyJamaicaJapanJordanKazakhstanKenyaKoreaKuwaitLaosLatin AmericaLatviaLebanonLiberiaLithuaniaMalaysiaMexicoMicronesiaMiddle AfricaMoldovaMoroccoNepalNetherlandsNicaraguaNigeriaNorth AmericaNorth MacedoniaNorthern AfricaNorthern EuropeNorwayOceaniaPakistanPanamaPeruPhilippinesPolandPortugalRomaniaRussiaSaudi ArabiaScotlandSenegalSerbiaSierra LeoneSingaporeSomaliaSouth AfricaSouth AmericaSouth Central AsiaSouth Eastern AsiaSouthern EuropeSpainSri LankaSt. Vincent and the GrenadinesSudanSwedenSwitzerlandSyriaTaiwanThailandTrinidad and TobagoTurkeyUgandaUkraineUruguayUzbekistanVenezuelaVietnamWest IndiesWestern AfricaWestern AsiaWestern EuropeYemenZaireZimbabweAzores
High School Diploma
Income
Poverty
Unemployment
Labor Participation
Family Structure
Vehicle Availability
Education Level
Disability

High School Diploma Comparison

Colombians

Nepalese

Tragic
Tragic
88.1%
HIGH SCHOOL DIPLOMA
3.8/ 100
METRIC RATING
231st/ 347
METRIC RANK
85.3%
HIGH SCHOOL DIPLOMA
0.0/ 100
METRIC RATING
304th/ 347
METRIC RANK

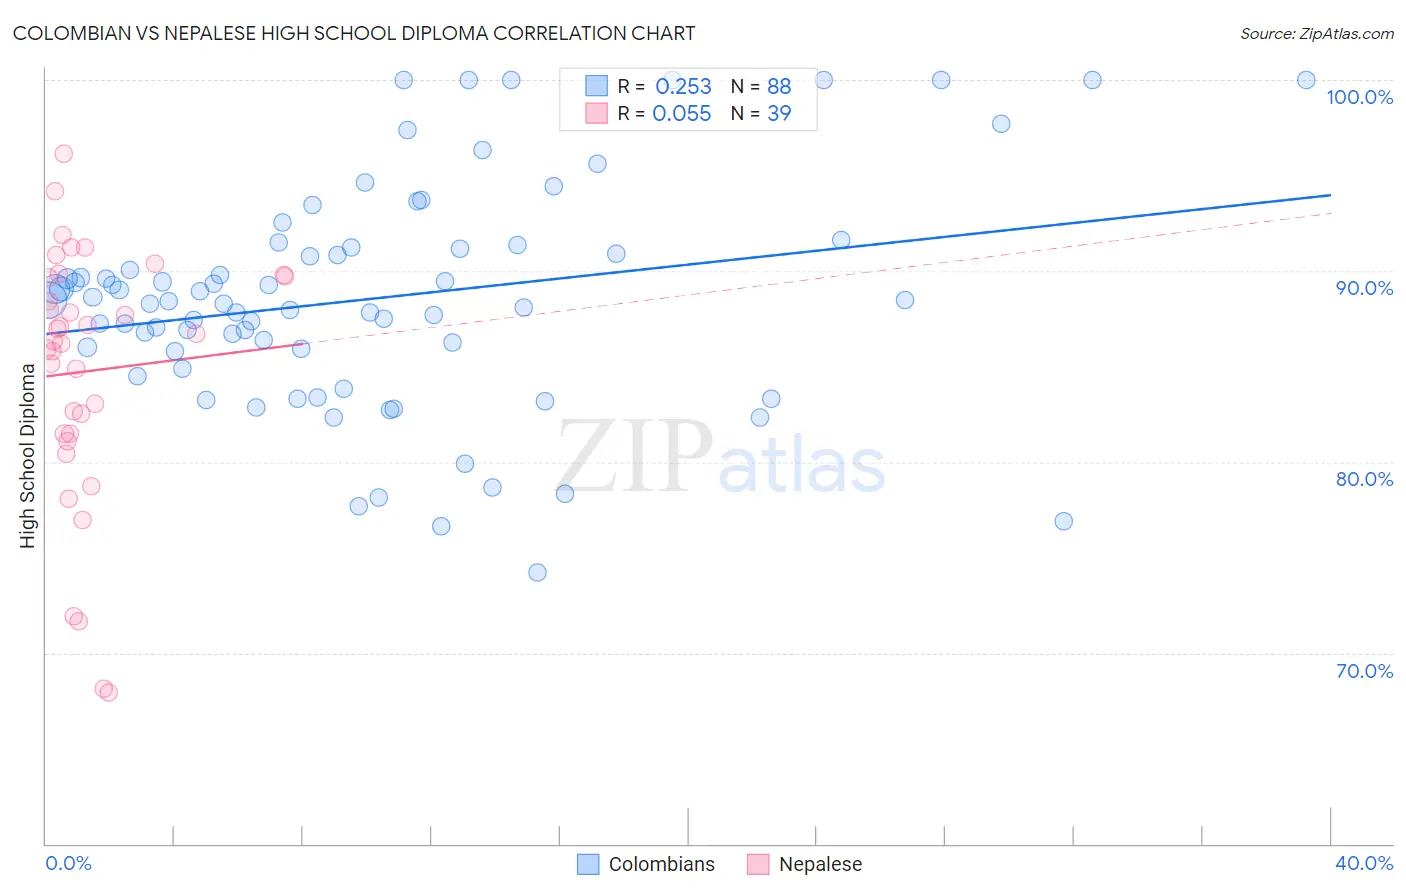
Colombian vs Nepalese High School Diploma Correlation Chart

The statistical analysis conducted on geographies consisting of 419,701,311 people shows a weak positive correlation between the proportion of Colombians and percentage of population with at least high school diploma education in the United States with a correlation coefficient (R) of 0.253 and weighted average of 88.1%. Similarly, the statistical analysis conducted on geographies consisting of 24,519,269 people shows a slight positive correlation between the proportion of Nepalese and percentage of population with at least high school diploma education in the United States with a correlation coefficient (R) of 0.055 and weighted average of 85.3%, a difference of 3.2%.
Colombian vs Nepalese High School Diploma

High School Diploma Correlation Summary

MeasurementColombianNepalese
Minimum74.2%67.9%
Maximum100.0%96.1%
Range25.8%28.2%
Mean88.6%84.7%
Median88.4%86.3%
Interquartile 25% (IQ1)85.9%81.5%
Interquartile 75% (IQ3)91.2%89.7%
Interquartile Range (IQR)5.3%8.3%
Standard Deviation (Sample)5.8%6.7%
Standard Deviation (Population)5.8%6.6%

Similar Demographics by High School Diploma

Demographics Similar to Colombians by High School Diploma

In terms of high school diploma, the demographic groups most similar to Colombians are Blackfeet (88.1%, a difference of 0.040%), Immigrants from Middle Africa (88.0%, a difference of 0.050%), Immigrants from Panama (88.0%, a difference of 0.080%), Immigrants from Thailand (88.0%, a difference of 0.090%), and Immigrants from Bahamas (88.0%, a difference of 0.10%).
DemographicsRating | RankHigh School Diploma
Shoshone
7.0
/100
|
#224
Tragic
88.3%
Creek
6.9
/100
|
#225
Tragic
88.3%
Uruguayans
5.6
/100
|
#226
Tragic
88.2%
Immigrants | Liberia
5.5
/100
|
#227
Tragic
88.2%
Kiowa
5.3
/100
|
#228
Tragic
88.2%
Nigerians
5.2
/100
|
#229
Tragic
88.2%
Blackfeet
4.2
/100
|
#230
Tragic
88.1%
Colombians
3.8
/100
|
#231
Tragic
88.1%
Immigrants | Middle Africa
3.4
/100
|
#232
Tragic
88.0%
Immigrants | Panama
3.1
/100
|
#233
Tragic
88.0%
Immigrants | Thailand
3.1
/100
|
#234
Tragic
88.0%
Immigrants | Bahamas
2.9
/100
|
#235
Tragic
88.0%
Sub-Saharan Africans
2.8
/100
|
#236
Tragic
87.9%
Taiwanese
2.8
/100
|
#237
Tragic
87.9%
Sioux
2.7
/100
|
#238
Tragic
87.9%

Demographics Similar to Nepalese by High School Diploma

In terms of high school diploma, the demographic groups most similar to Nepalese are Immigrants from Portugal (85.3%, a difference of 0.010%), Immigrants from Guyana (85.3%, a difference of 0.050%), Immigrants from Haiti (85.4%, a difference of 0.11%), Cuban (85.4%, a difference of 0.11%), and Navajo (85.2%, a difference of 0.14%).
DemographicsRating | RankHigh School Diploma
Immigrants | Grenada
0.0
/100
|
#297
Tragic
85.6%
Natives/Alaskans
0.0
/100
|
#298
Tragic
85.6%
Guyanese
0.0
/100
|
#299
Tragic
85.5%
Immigrants | Bangladesh
0.0
/100
|
#300
Tragic
85.5%
Vietnamese
0.0
/100
|
#301
Tragic
85.4%
Immigrants | Haiti
0.0
/100
|
#302
Tragic
85.4%
Cubans
0.0
/100
|
#303
Tragic
85.4%
Nepalese
0.0
/100
|
#304
Tragic
85.3%
Immigrants | Portugal
0.0
/100
|
#305
Tragic
85.3%
Immigrants | Guyana
0.0
/100
|
#306
Tragic
85.3%
Navajo
0.0
/100
|
#307
Tragic
85.2%
Immigrants | Armenia
0.0
/100
|
#308
Tragic
85.2%
Immigrants | Dominica
0.0
/100
|
#309
Tragic
85.2%
Apache
0.0
/100
|
#310
Tragic
85.1%
Ecuadorians
0.0
/100
|
#311
Tragic
85.1%