Immigrants from Peru vs Immigrants from Sudan 11th Grade
COMPARE
Immigrants from Peru
Immigrants from Sudan
11th Grade
11th Grade Comparison
Immigrants from Peru
Immigrants from Sudan
91.0%
11TH GRADE
0.1/ 100
METRIC RATING
271st/ 347
METRIC RANK
92.3%
11TH GRADE
23.5/ 100
METRIC RATING
203rd/ 347
METRIC RANK
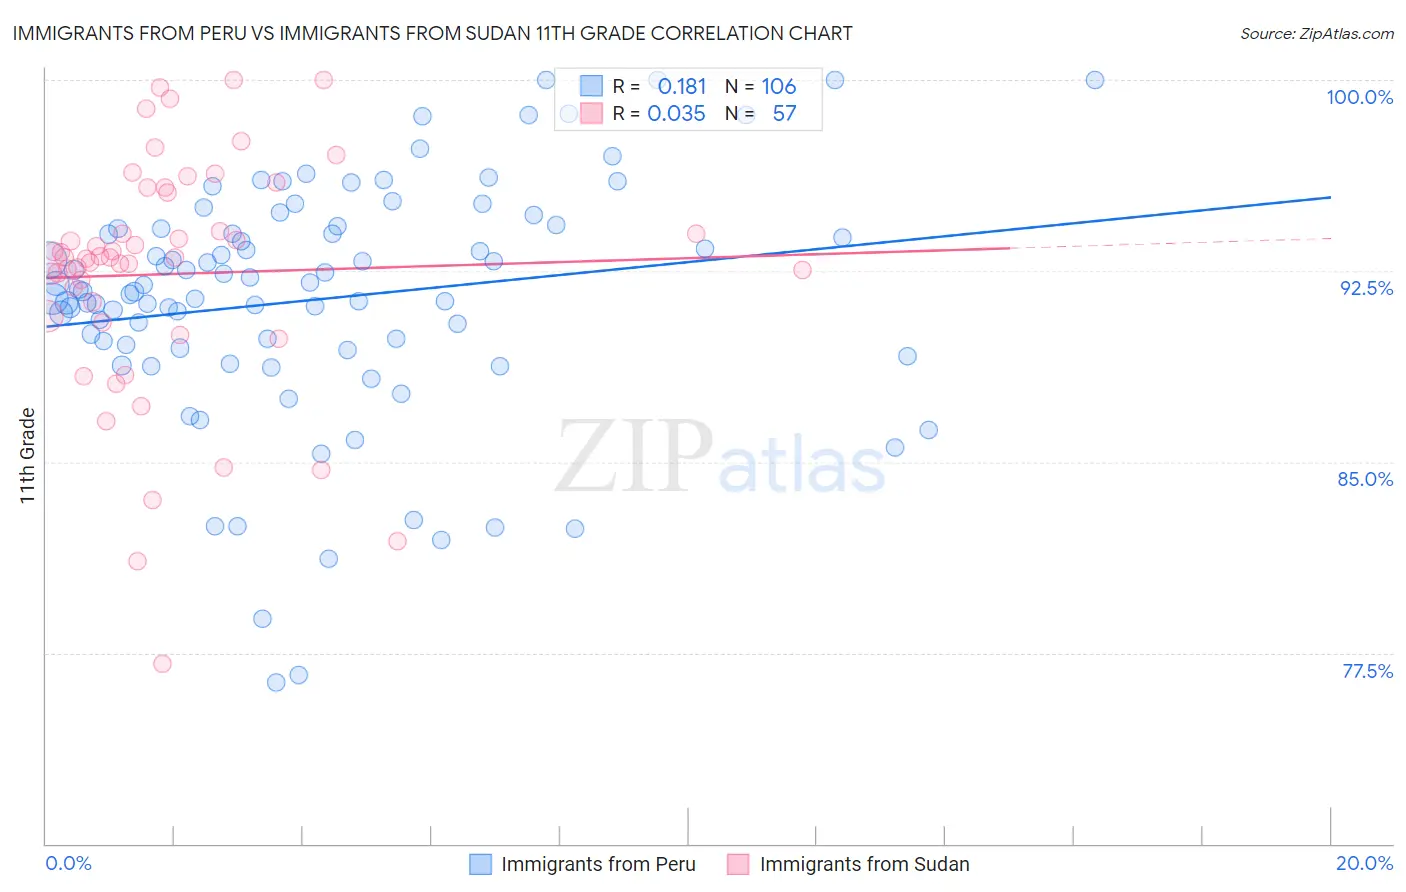
Immigrants from Peru vs Immigrants from Sudan 11th Grade Correlation Chart
The statistical analysis conducted on geographies consisting of 328,860,880 people shows a poor positive correlation between the proportion of Immigrants from Peru and percentage of population with at least 11th grade education in the United States with a correlation coefficient (R) of 0.181 and weighted average of 91.0%. Similarly, the statistical analysis conducted on geographies consisting of 118,959,807 people shows no correlation between the proportion of Immigrants from Sudan and percentage of population with at least 11th grade education in the United States with a correlation coefficient (R) of 0.035 and weighted average of 92.3%, a difference of 1.3%.
11th Grade Correlation Summary
| Measurement | Immigrants from Peru | Immigrants from Sudan |
| Minimum | 76.3% | 77.1% |
| Maximum | 100.0% | 100.0% |
| Range | 23.7% | 22.9% |
| Mean | 91.4% | 92.4% |
| Median | 91.7% | 93.0% |
| Interquartile 25% (IQ1) | 89.5% | 90.6% |
| Interquartile 75% (IQ3) | 94.2% | 95.7% |
| Interquartile Range (IQR) | 4.7% | 5.1% |
| Standard Deviation (Sample) | 4.8% | 4.7% |
| Standard Deviation (Population) | 4.7% | 4.7% |
Similar Demographics by 11th Grade
Demographics Similar to Immigrants from Peru by 11th Grade
In terms of 11th grade, the demographic groups most similar to Immigrants from Peru are West Indian (91.0%, a difference of 0.0%), Trinidadian and Tobagonian (91.1%, a difference of 0.030%), Paiute (91.0%, a difference of 0.050%), Ute (91.1%, a difference of 0.060%), and U.S. Virgin Islander (91.1%, a difference of 0.090%).
| Demographics | Rating | Rank | 11th Grade |
| Yup'ik | 0.3 /100 | #264 | Tragic 91.2% |
| Pueblo | 0.3 /100 | #265 | Tragic 91.2% |
| Immigrants | Western Africa | 0.3 /100 | #266 | Tragic 91.2% |
| Immigrants | Jamaica | 0.3 /100 | #267 | Tragic 91.2% |
| U.S. Virgin Islanders | 0.2 /100 | #268 | Tragic 91.1% |
| Ute | 0.2 /100 | #269 | Tragic 91.1% |
| Trinidadians and Tobagonians | 0.2 /100 | #270 | Tragic 91.1% |
| Immigrants | Peru | 0.1 /100 | #271 | Tragic 91.0% |
| West Indians | 0.1 /100 | #272 | Tragic 91.0% |
| Paiute | 0.1 /100 | #273 | Tragic 91.0% |
| Immigrants | Trinidad and Tobago | 0.1 /100 | #274 | Tragic 90.9% |
| Immigrants | South Eastern Asia | 0.1 /100 | #275 | Tragic 90.9% |
| Bangladeshis | 0.1 /100 | #276 | Tragic 90.9% |
| Immigrants | Congo | 0.1 /100 | #277 | Tragic 90.9% |
| Malaysians | 0.1 /100 | #278 | Tragic 90.8% |
Demographics Similar to Immigrants from Sudan by 11th Grade
In terms of 11th grade, the demographic groups most similar to Immigrants from Sudan are Immigrants from Hong Kong (92.2%, a difference of 0.0%), Kiowa (92.2%, a difference of 0.0%), Bolivian (92.2%, a difference of 0.0%), Immigrants from Eastern Africa (92.3%, a difference of 0.010%), and Immigrants from Oceania (92.2%, a difference of 0.010%).
| Demographics | Rating | Rank | 11th Grade |
| Panamanians | 26.4 /100 | #196 | Fair 92.3% |
| Marshallese | 26.0 /100 | #197 | Fair 92.3% |
| Hawaiians | 25.5 /100 | #198 | Fair 92.3% |
| Immigrants | Uganda | 25.2 /100 | #199 | Fair 92.3% |
| Samoans | 25.1 /100 | #200 | Fair 92.3% |
| Immigrants | China | 25.1 /100 | #201 | Fair 92.3% |
| Immigrants | Eastern Africa | 24.1 /100 | #202 | Fair 92.3% |
| Immigrants | Sudan | 23.5 /100 | #203 | Fair 92.3% |
| Immigrants | Hong Kong | 23.3 /100 | #204 | Fair 92.2% |
| Kiowa | 23.2 /100 | #205 | Fair 92.2% |
| Bolivians | 23.2 /100 | #206 | Fair 92.2% |
| Immigrants | Oceania | 22.4 /100 | #207 | Fair 92.2% |
| Colville | 21.8 /100 | #208 | Fair 92.2% |
| Tongans | 19.8 /100 | #209 | Poor 92.2% |
| Ethiopians | 18.8 /100 | #210 | Poor 92.2% |