Immigrants from Panama vs Australian 5th Grade
COMPARE
Immigrants from Panama
Australian
5th Grade
5th Grade Comparison
Immigrants from Panama
Australians
97.0%
5TH GRADE
5.7/ 100
METRIC RATING
222nd/ 347
METRIC RANK
98.0%
5TH GRADE
99.8/ 100
METRIC RATING
54th/ 347
METRIC RANK
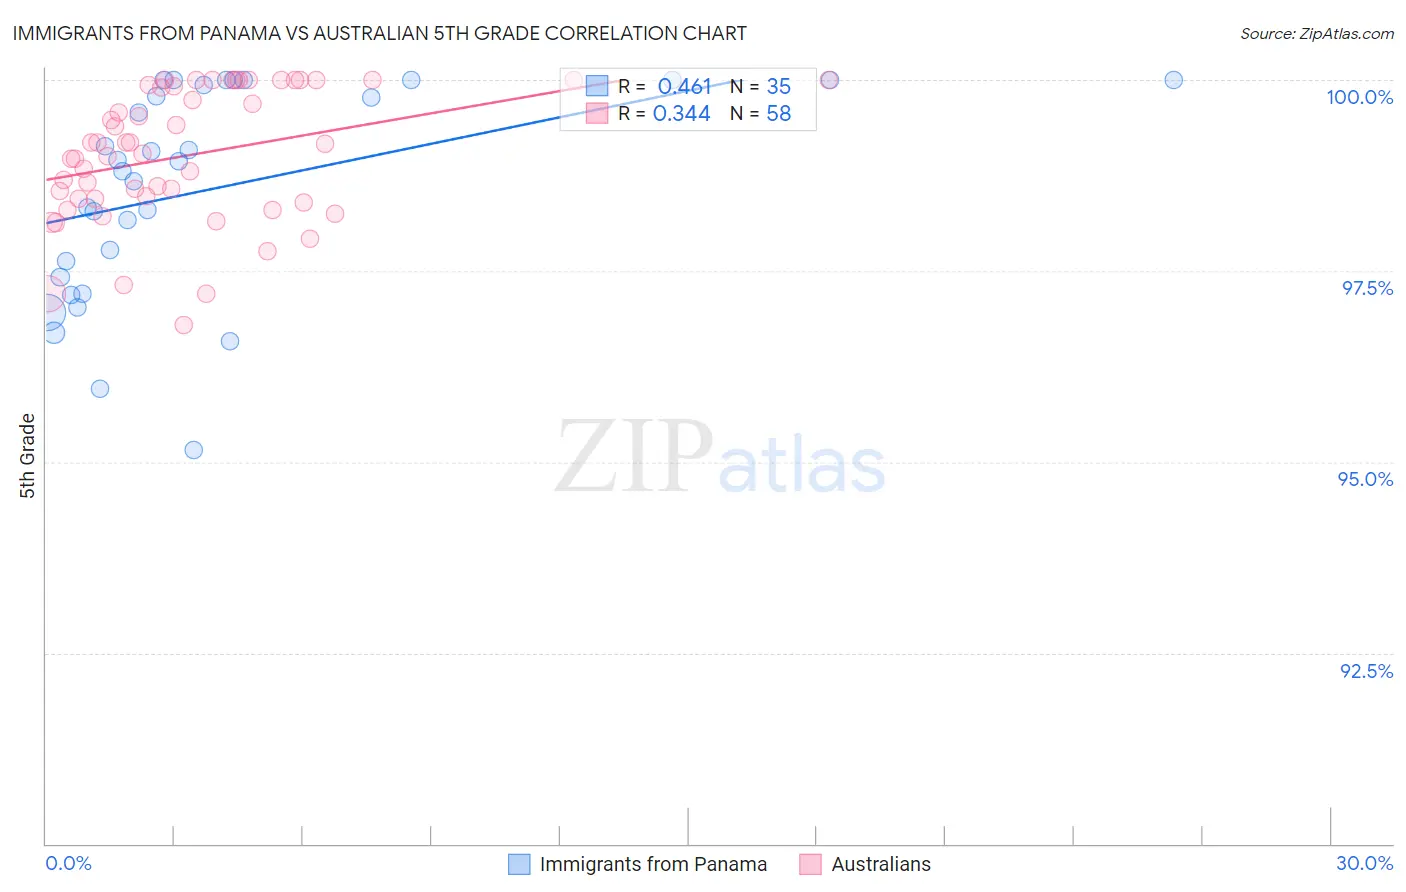
Immigrants from Panama vs Australian 5th Grade Correlation Chart
The statistical analysis conducted on geographies consisting of 221,182,871 people shows a moderate positive correlation between the proportion of Immigrants from Panama and percentage of population with at least 5th grade education in the United States with a correlation coefficient (R) of 0.461 and weighted average of 97.0%. Similarly, the statistical analysis conducted on geographies consisting of 224,153,392 people shows a mild positive correlation between the proportion of Australians and percentage of population with at least 5th grade education in the United States with a correlation coefficient (R) of 0.344 and weighted average of 98.0%, a difference of 0.94%.
5th Grade Correlation Summary
| Measurement | Immigrants from Panama | Australian |
| Minimum | 95.1% | 96.8% |
| Maximum | 100.0% | 100.0% |
| Range | 4.9% | 3.2% |
| Mean | 98.6% | 99.0% |
| Median | 98.9% | 99.1% |
| Interquartile 25% (IQ1) | 97.4% | 98.4% |
| Interquartile 75% (IQ3) | 100.0% | 99.9% |
| Interquartile Range (IQR) | 2.6% | 1.5% |
| Standard Deviation (Sample) | 1.4% | 0.86% |
| Standard Deviation (Population) | 1.3% | 0.86% |
Similar Demographics by 5th Grade
Demographics Similar to Immigrants from Panama by 5th Grade
In terms of 5th grade, the demographic groups most similar to Immigrants from Panama are Sierra Leonean (97.1%, a difference of 0.0%), Liberian (97.0%, a difference of 0.0%), Immigrants from Sudan (97.1%, a difference of 0.010%), Immigrants from Syria (97.1%, a difference of 0.010%), and Immigrants from Southern Europe (97.1%, a difference of 0.010%).
| Demographics | Rating | Rank | 5th Grade |
| Immigrants | Morocco | 7.5 /100 | #215 | Tragic 97.1% |
| Sudanese | 7.0 /100 | #216 | Tragic 97.1% |
| Immigrants | Lebanon | 6.8 /100 | #217 | Tragic 97.1% |
| Immigrants | Sudan | 6.5 /100 | #218 | Tragic 97.1% |
| Immigrants | Syria | 6.4 /100 | #219 | Tragic 97.1% |
| Immigrants | Southern Europe | 6.3 /100 | #220 | Tragic 97.1% |
| Sierra Leoneans | 6.0 /100 | #221 | Tragic 97.1% |
| Immigrants | Panama | 5.7 /100 | #222 | Tragic 97.0% |
| Liberians | 5.7 /100 | #223 | Tragic 97.0% |
| South American Indians | 5.4 /100 | #224 | Tragic 97.0% |
| Bahamians | 5.3 /100 | #225 | Tragic 97.0% |
| Tongans | 5.3 /100 | #226 | Tragic 97.0% |
| Immigrants | Pakistan | 4.7 /100 | #227 | Tragic 97.0% |
| Assyrians/Chaldeans/Syriacs | 4.5 /100 | #228 | Tragic 97.0% |
| Yuman | 4.5 /100 | #229 | Tragic 97.0% |
Demographics Similar to Australians by 5th Grade
In terms of 5th grade, the demographic groups most similar to Australians are Maltese (98.0%, a difference of 0.010%), Slavic (98.0%, a difference of 0.010%), Creek (98.0%, a difference of 0.010%), Greek (97.9%, a difference of 0.010%), and Austrian (97.9%, a difference of 0.010%).
| Demographics | Rating | Rank | 5th Grade |
| Native Hawaiians | 99.9 /100 | #47 | Exceptional 98.0% |
| Bulgarians | 99.8 /100 | #48 | Exceptional 98.0% |
| Estonians | 99.8 /100 | #49 | Exceptional 98.0% |
| Immigrants | Scotland | 99.8 /100 | #50 | Exceptional 98.0% |
| Celtics | 99.8 /100 | #51 | Exceptional 98.0% |
| Maltese | 99.8 /100 | #52 | Exceptional 98.0% |
| Slavs | 99.8 /100 | #53 | Exceptional 98.0% |
| Australians | 99.8 /100 | #54 | Exceptional 98.0% |
| Creek | 99.8 /100 | #55 | Exceptional 98.0% |
| Greeks | 99.8 /100 | #56 | Exceptional 97.9% |
| Austrians | 99.8 /100 | #57 | Exceptional 97.9% |
| Whites/Caucasians | 99.8 /100 | #58 | Exceptional 97.9% |
| Americans | 99.7 /100 | #59 | Exceptional 97.9% |
| Immigrants | Canada | 99.7 /100 | #60 | Exceptional 97.9% |
| Serbians | 99.7 /100 | #61 | Exceptional 97.9% |