Immigrants from Pakistan vs Colombian Unemployment Among Ages 16 to 19 years
COMPARE
Immigrants from Pakistan
Colombian
Unemployment Among Ages 16 to 19 years
Unemployment Among Ages 16 to 19 years Comparison
Immigrants from Pakistan
Colombians
17.0%
UNEMPLOYMENT AMONG AGES 16 TO 19 YEARS
94.6/ 100
METRIC RATING
102nd/ 347
METRIC RANK
18.3%
UNEMPLOYMENT AMONG AGES 16 TO 19 YEARS
3.7/ 100
METRIC RATING
234th/ 347
METRIC RANK
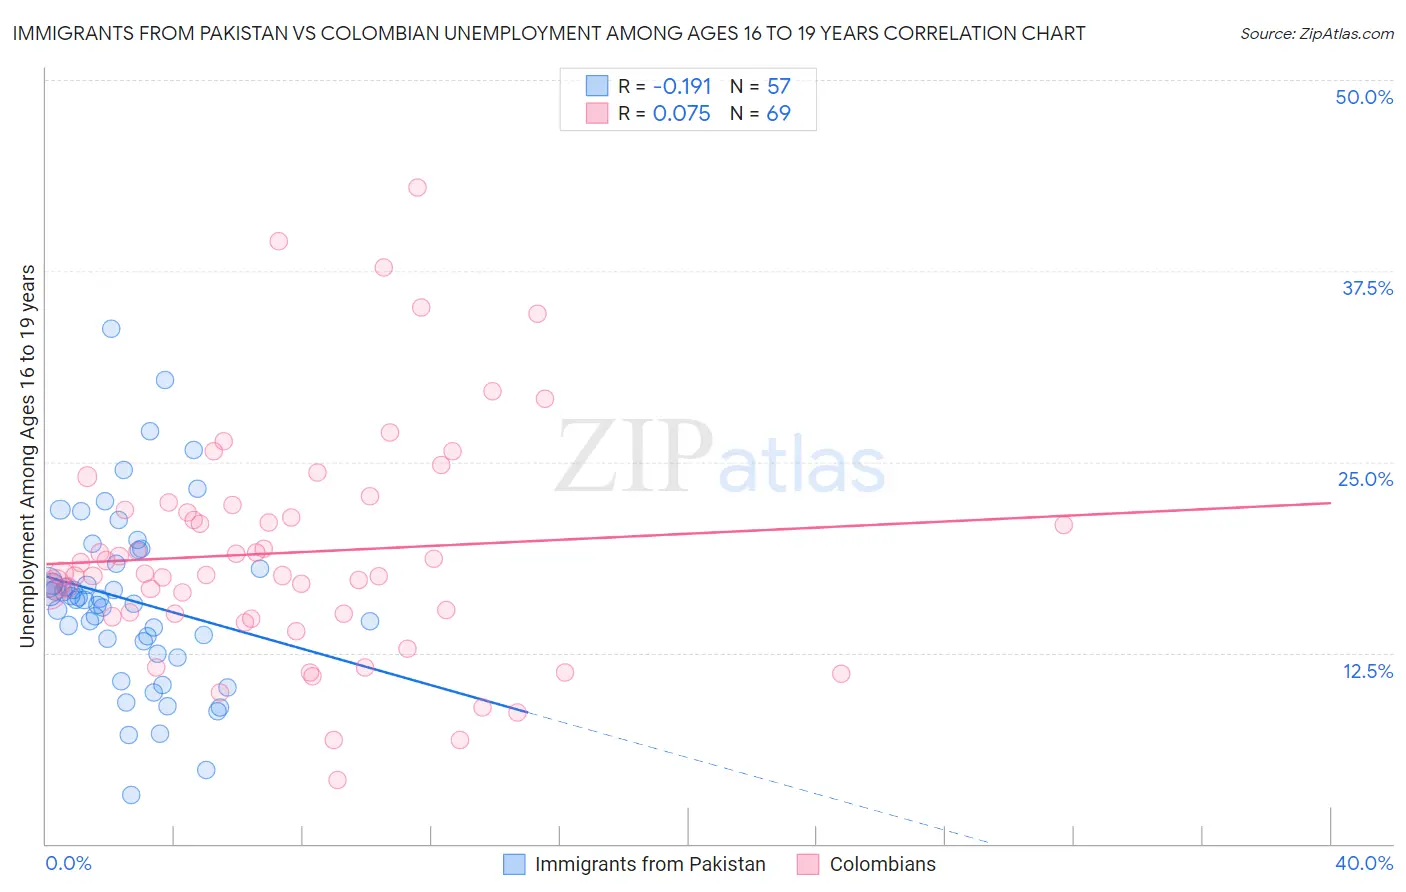
Immigrants from Pakistan vs Colombian Unemployment Among Ages 16 to 19 years Correlation Chart
The statistical analysis conducted on geographies consisting of 274,773,140 people shows a poor negative correlation between the proportion of Immigrants from Pakistan and unemployment rate among population between the ages 16 and 19 in the United States with a correlation coefficient (R) of -0.191 and weighted average of 17.0%. Similarly, the statistical analysis conducted on geographies consisting of 397,781,439 people shows a slight positive correlation between the proportion of Colombians and unemployment rate among population between the ages 16 and 19 in the United States with a correlation coefficient (R) of 0.075 and weighted average of 18.3%, a difference of 7.5%.
Unemployment Among Ages 16 to 19 years Correlation Summary
| Measurement | Immigrants from Pakistan | Colombian |
| Minimum | 3.2% | 4.2% |
| Maximum | 33.7% | 43.0% |
| Range | 30.6% | 38.8% |
| Mean | 16.0% | 19.1% |
| Median | 16.0% | 17.7% |
| Interquartile 25% (IQ1) | 12.8% | 14.9% |
| Interquartile 75% (IQ3) | 18.8% | 22.0% |
| Interquartile Range (IQR) | 5.9% | 7.1% |
| Standard Deviation (Sample) | 5.8% | 7.5% |
| Standard Deviation (Population) | 5.8% | 7.5% |
Similar Demographics by Unemployment Among Ages 16 to 19 years
Demographics Similar to Immigrants from Pakistan by Unemployment Among Ages 16 to 19 years
In terms of unemployment among ages 16 to 19 years, the demographic groups most similar to Immigrants from Pakistan are Palestinian (17.0%, a difference of 0.010%), Immigrants from Saudi Arabia (17.0%, a difference of 0.020%), Italian (17.0%, a difference of 0.020%), Immigrants from Thailand (17.0%, a difference of 0.030%), and Immigrants from Bulgaria (17.0%, a difference of 0.060%).
| Demographics | Rating | Rank | Unemployment Among Ages 16 to 19 years |
| Mongolians | 95.6 /100 | #95 | Exceptional 16.9% |
| Ottawa | 95.4 /100 | #96 | Exceptional 16.9% |
| Immigrants | Venezuela | 95.3 /100 | #97 | Exceptional 16.9% |
| Burmese | 95.0 /100 | #98 | Exceptional 17.0% |
| Immigrants | Lithuania | 94.9 /100 | #99 | Exceptional 17.0% |
| Immigrants | Thailand | 94.7 /100 | #100 | Exceptional 17.0% |
| Immigrants | Saudi Arabia | 94.7 /100 | #101 | Exceptional 17.0% |
| Immigrants | Pakistan | 94.6 /100 | #102 | Exceptional 17.0% |
| Palestinians | 94.6 /100 | #103 | Exceptional 17.0% |
| Italians | 94.5 /100 | #104 | Exceptional 17.0% |
| Immigrants | Bulgaria | 94.3 /100 | #105 | Exceptional 17.0% |
| Estonians | 94.3 /100 | #106 | Exceptional 17.0% |
| Immigrants | Brazil | 94.2 /100 | #107 | Exceptional 17.0% |
| Malaysians | 94.2 /100 | #108 | Exceptional 17.0% |
| Iranians | 94.1 /100 | #109 | Exceptional 17.0% |
Demographics Similar to Colombians by Unemployment Among Ages 16 to 19 years
In terms of unemployment among ages 16 to 19 years, the demographic groups most similar to Colombians are Immigrants from Russia (18.2%, a difference of 0.11%), Seminole (18.2%, a difference of 0.11%), Nepalese (18.2%, a difference of 0.16%), Spanish American (18.2%, a difference of 0.29%), and French American Indian (18.3%, a difference of 0.29%).
| Demographics | Rating | Rank | Unemployment Among Ages 16 to 19 years |
| Immigrants | Liberia | 7.1 /100 | #227 | Tragic 18.1% |
| Immigrants | Greece | 7.1 /100 | #228 | Tragic 18.1% |
| Albanians | 5.8 /100 | #229 | Tragic 18.2% |
| Spanish Americans | 4.7 /100 | #230 | Tragic 18.2% |
| Nepalese | 4.2 /100 | #231 | Tragic 18.2% |
| Immigrants | Russia | 4.0 /100 | #232 | Tragic 18.2% |
| Seminole | 4.0 /100 | #233 | Tragic 18.2% |
| Colombians | 3.7 /100 | #234 | Tragic 18.3% |
| French American Indians | 2.9 /100 | #235 | Tragic 18.3% |
| Immigrants | Colombia | 2.7 /100 | #236 | Tragic 18.3% |
| Immigrants | Immigrants | 2.7 /100 | #237 | Tragic 18.3% |
| South Americans | 2.6 /100 | #238 | Tragic 18.3% |
| Native Hawaiians | 2.4 /100 | #239 | Tragic 18.3% |
| Immigrants | Cabo Verde | 2.0 /100 | #240 | Tragic 18.4% |
| Immigrants | Ukraine | 1.3 /100 | #241 | Tragic 18.5% |