Shoshone vs Immigrants from Canada 8th Grade
COMPARE
Shoshone
Immigrants from Canada
8th Grade
8th Grade Comparison
Shoshone
Immigrants from Canada
96.3%
8TH GRADE
96.8/ 100
METRIC RATING
111th/ 347
METRIC RANK
96.7%
8TH GRADE
99.8/ 100
METRIC RATING
58th/ 347
METRIC RANK
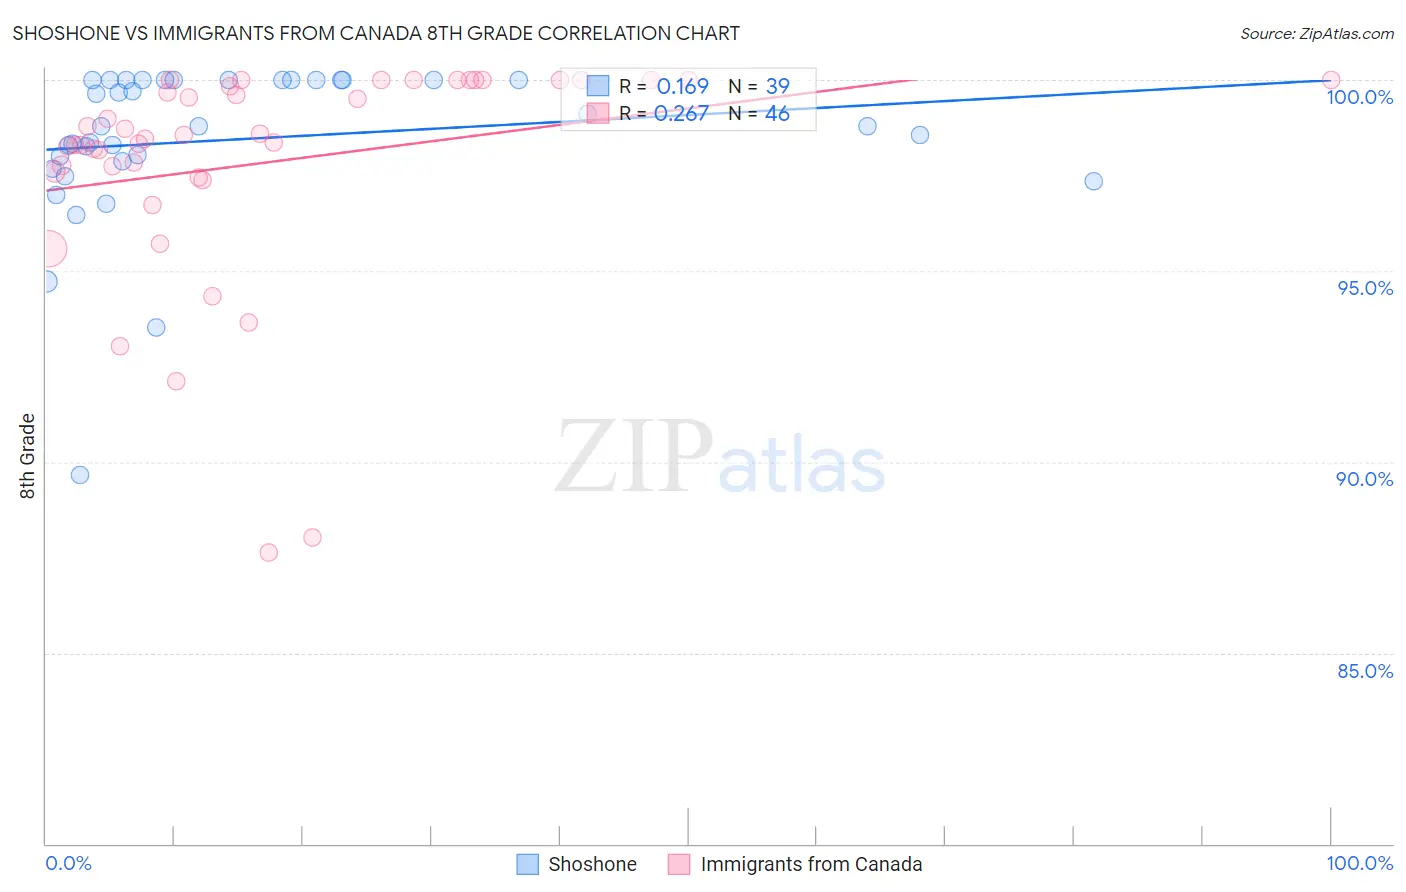
Shoshone vs Immigrants from Canada 8th Grade Correlation Chart
The statistical analysis conducted on geographies consisting of 66,625,086 people shows a poor positive correlation between the proportion of Shoshone and percentage of population with at least 8th grade education in the United States with a correlation coefficient (R) of 0.169 and weighted average of 96.3%. Similarly, the statistical analysis conducted on geographies consisting of 459,397,484 people shows a weak positive correlation between the proportion of Immigrants from Canada and percentage of population with at least 8th grade education in the United States with a correlation coefficient (R) of 0.267 and weighted average of 96.7%, a difference of 0.45%.
8th Grade Correlation Summary
| Measurement | Shoshone | Immigrants from Canada |
| Minimum | 89.7% | 87.6% |
| Maximum | 100.0% | 100.0% |
| Range | 10.3% | 12.4% |
| Mean | 98.4% | 97.8% |
| Median | 98.8% | 98.5% |
| Interquartile 25% (IQ1) | 97.9% | 97.6% |
| Interquartile 75% (IQ3) | 100.0% | 100.0% |
| Interquartile Range (IQR) | 2.1% | 2.4% |
| Standard Deviation (Sample) | 2.1% | 2.9% |
| Standard Deviation (Population) | 2.1% | 2.9% |
Similar Demographics by 8th Grade
Demographics Similar to Shoshone by 8th Grade
In terms of 8th grade, the demographic groups most similar to Shoshone are Syrian (96.3%, a difference of 0.0%), Immigrants from Zimbabwe (96.3%, a difference of 0.010%), Immigrants from Japan (96.2%, a difference of 0.010%), Immigrants from Moldova (96.2%, a difference of 0.010%), and Cajun (96.3%, a difference of 0.020%).
| Demographics | Rating | Rank | 8th Grade |
| Kiowa | 98.0 /100 | #104 | Exceptional 96.3% |
| Immigrants | North Macedonia | 98.0 /100 | #105 | Exceptional 96.3% |
| Okinawans | 98.0 /100 | #106 | Exceptional 96.3% |
| Immigrants | Latvia | 97.8 /100 | #107 | Exceptional 96.3% |
| Lebanese | 97.5 /100 | #108 | Exceptional 96.3% |
| Iroquois | 97.5 /100 | #109 | Exceptional 96.3% |
| Cajuns | 97.1 /100 | #110 | Exceptional 96.3% |
| Shoshone | 96.8 /100 | #111 | Exceptional 96.3% |
| Syrians | 96.7 /100 | #112 | Exceptional 96.3% |
| Immigrants | Zimbabwe | 96.7 /100 | #113 | Exceptional 96.3% |
| Immigrants | Japan | 96.5 /100 | #114 | Exceptional 96.2% |
| Immigrants | Moldova | 96.5 /100 | #115 | Exceptional 96.2% |
| Immigrants | Nonimmigrants | 96.0 /100 | #116 | Exceptional 96.2% |
| Immigrants | Croatia | 96.0 /100 | #117 | Exceptional 96.2% |
| Immigrants | Norway | 95.7 /100 | #118 | Exceptional 96.2% |
Demographics Similar to Immigrants from Canada by 8th Grade
In terms of 8th grade, the demographic groups most similar to Immigrants from Canada are Immigrants from North America (96.7%, a difference of 0.010%), Immigrants from Northern Europe (96.7%, a difference of 0.020%), Immigrants from Austria (96.7%, a difference of 0.020%), White/Caucasian (96.7%, a difference of 0.030%), and Russian (96.7%, a difference of 0.040%).
| Demographics | Rating | Rank | 8th Grade |
| Celtics | 99.9 /100 | #51 | Exceptional 96.8% |
| Greeks | 99.9 /100 | #52 | Exceptional 96.8% |
| Austrians | 99.9 /100 | #53 | Exceptional 96.7% |
| Serbians | 99.8 /100 | #54 | Exceptional 96.7% |
| Russians | 99.8 /100 | #55 | Exceptional 96.7% |
| Australians | 99.8 /100 | #56 | Exceptional 96.7% |
| Macedonians | 99.8 /100 | #57 | Exceptional 96.7% |
| Immigrants | Canada | 99.8 /100 | #58 | Exceptional 96.7% |
| Immigrants | North America | 99.8 /100 | #59 | Exceptional 96.7% |
| Immigrants | Northern Europe | 99.8 /100 | #60 | Exceptional 96.7% |
| Immigrants | Austria | 99.8 /100 | #61 | Exceptional 96.7% |
| Whites/Caucasians | 99.8 /100 | #62 | Exceptional 96.7% |
| Ukrainians | 99.7 /100 | #63 | Exceptional 96.7% |
| Immigrants | India | 99.7 /100 | #64 | Exceptional 96.6% |
| Native Hawaiians | 99.7 /100 | #65 | Exceptional 96.6% |