Immigrants from Northern Europe vs Venezuelan 5th Grade
COMPARE
Immigrants from Northern Europe
Venezuelan
5th Grade
5th Grade Comparison
Immigrants from Northern Europe
Venezuelans
97.9%
5TH GRADE
99.6/ 100
METRIC RATING
64th/ 347
METRIC RANK
97.3%
5TH GRADE
54.0/ 100
METRIC RATING
170th/ 347
METRIC RANK
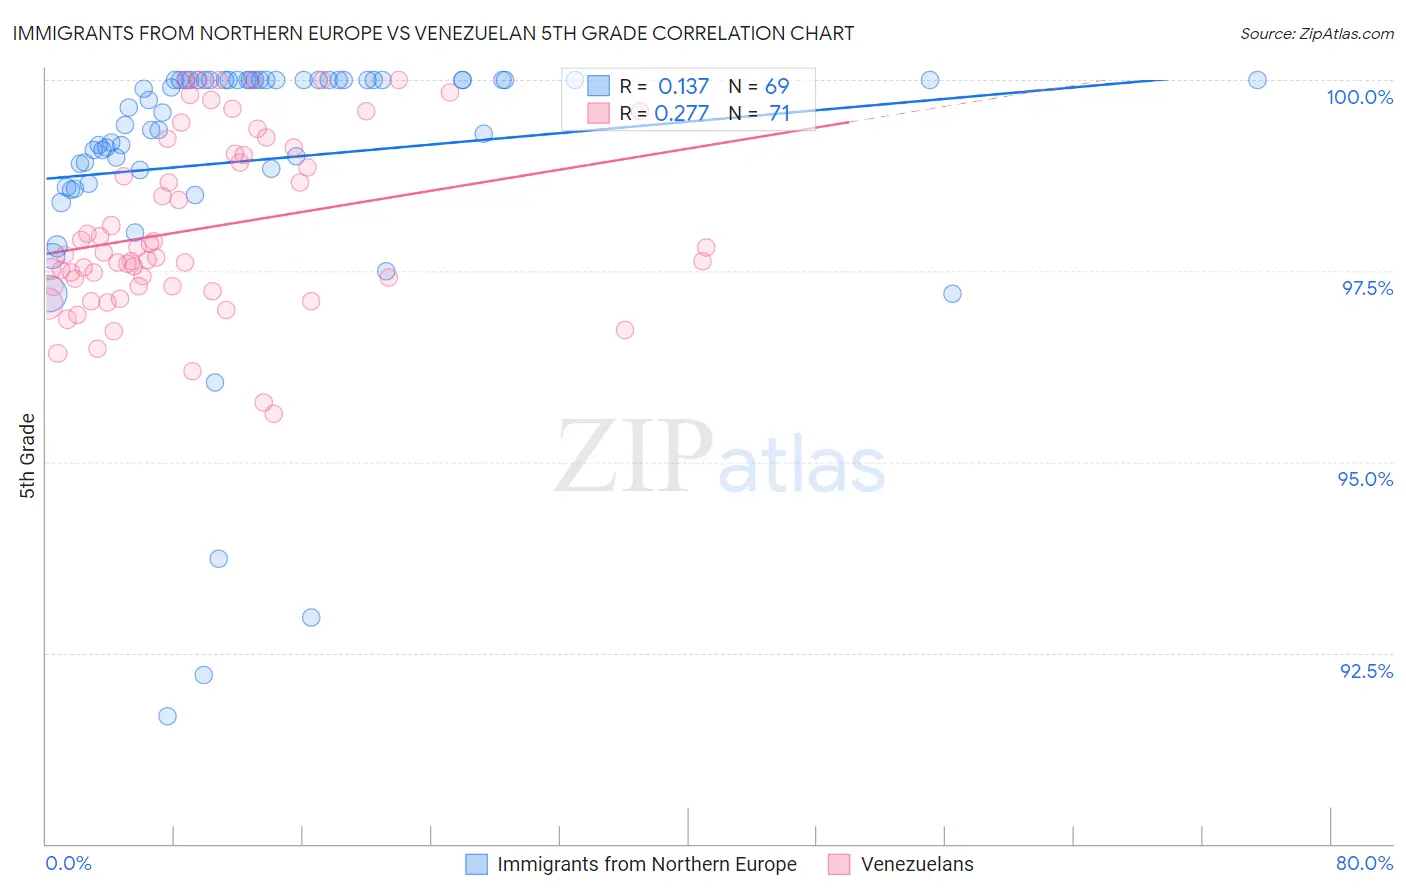
Immigrants from Northern Europe vs Venezuelan 5th Grade Correlation Chart
The statistical analysis conducted on geographies consisting of 477,226,800 people shows a poor positive correlation between the proportion of Immigrants from Northern Europe and percentage of population with at least 5th grade education in the United States with a correlation coefficient (R) of 0.137 and weighted average of 97.9%. Similarly, the statistical analysis conducted on geographies consisting of 306,323,638 people shows a weak positive correlation between the proportion of Venezuelans and percentage of population with at least 5th grade education in the United States with a correlation coefficient (R) of 0.277 and weighted average of 97.3%, a difference of 0.57%.
5th Grade Correlation Summary
| Measurement | Immigrants from Northern Europe | Venezuelan |
| Minimum | 91.7% | 95.6% |
| Maximum | 100.0% | 100.0% |
| Range | 8.3% | 4.4% |
| Mean | 99.0% | 98.1% |
| Median | 99.6% | 97.7% |
| Interquartile 25% (IQ1) | 98.7% | 97.3% |
| Interquartile 75% (IQ3) | 100.0% | 99.0% |
| Interquartile Range (IQR) | 1.3% | 1.7% |
| Standard Deviation (Sample) | 1.8% | 1.1% |
| Standard Deviation (Population) | 1.8% | 1.1% |
Similar Demographics by 5th Grade
Demographics Similar to Immigrants from Northern Europe by 5th Grade
In terms of 5th grade, the demographic groups most similar to Immigrants from Northern Europe are Canadian (97.9%, a difference of 0.0%), Immigrants from Austria (97.9%, a difference of 0.010%), New Zealander (97.9%, a difference of 0.010%), Serbian (97.9%, a difference of 0.020%), and Immigrants from North America (97.9%, a difference of 0.020%).
| Demographics | Rating | Rank | 5th Grade |
| Austrians | 99.8 /100 | #57 | Exceptional 97.9% |
| Whites/Caucasians | 99.8 /100 | #58 | Exceptional 97.9% |
| Americans | 99.7 /100 | #59 | Exceptional 97.9% |
| Immigrants | Canada | 99.7 /100 | #60 | Exceptional 97.9% |
| Serbians | 99.7 /100 | #61 | Exceptional 97.9% |
| Immigrants | North America | 99.7 /100 | #62 | Exceptional 97.9% |
| Russians | 99.7 /100 | #63 | Exceptional 97.9% |
| Immigrants | Northern Europe | 99.6 /100 | #64 | Exceptional 97.9% |
| Canadians | 99.6 /100 | #65 | Exceptional 97.9% |
| Immigrants | Austria | 99.6 /100 | #66 | Exceptional 97.9% |
| New Zealanders | 99.6 /100 | #67 | Exceptional 97.9% |
| Cajuns | 99.6 /100 | #68 | Exceptional 97.9% |
| Kiowa | 99.5 /100 | #69 | Exceptional 97.9% |
| Iranians | 99.5 /100 | #70 | Exceptional 97.9% |
| Chickasaw | 99.5 /100 | #71 | Exceptional 97.9% |
Demographics Similar to Venezuelans by 5th Grade
In terms of 5th grade, the demographic groups most similar to Venezuelans are Immigrants from Belarus (97.3%, a difference of 0.0%), Chilean (97.3%, a difference of 0.0%), Immigrants from Korea (97.3%, a difference of 0.0%), Immigrants from Sri Lanka (97.3%, a difference of 0.0%), and Arab (97.3%, a difference of 0.0%).
| Demographics | Rating | Rank | 5th Grade |
| Ugandans | 58.9 /100 | #163 | Average 97.4% |
| Bermudans | 58.8 /100 | #164 | Average 97.4% |
| Immigrants | Poland | 57.9 /100 | #165 | Average 97.4% |
| Apache | 57.2 /100 | #166 | Average 97.4% |
| Immigrants | Belarus | 54.6 /100 | #167 | Average 97.3% |
| Chileans | 54.5 /100 | #168 | Average 97.3% |
| Immigrants | Korea | 54.1 /100 | #169 | Average 97.3% |
| Venezuelans | 54.0 /100 | #170 | Average 97.3% |
| Immigrants | Sri Lanka | 53.8 /100 | #171 | Average 97.3% |
| Arabs | 53.4 /100 | #172 | Average 97.3% |
| Egyptians | 52.4 /100 | #173 | Average 97.3% |
| Immigrants | Kazakhstan | 50.0 /100 | #174 | Average 97.3% |
| Immigrants | Micronesia | 48.8 /100 | #175 | Average 97.3% |
| Immigrants | Taiwan | 48.4 /100 | #176 | Average 97.3% |
| Immigrants | Spain | 47.0 /100 | #177 | Average 97.3% |