Immigrants from Northern Europe vs Venezuelan Female Disability
COMPARE
Immigrants from Northern Europe
Venezuelan
Female Disability
Female Disability Comparison
Immigrants from Northern Europe
Venezuelans
11.6%
FEMALE DISABILITY
99.4/ 100
METRIC RATING
95th/ 347
METRIC RANK
11.0%
FEMALE DISABILITY
100.0/ 100
METRIC RATING
23rd/ 347
METRIC RANK
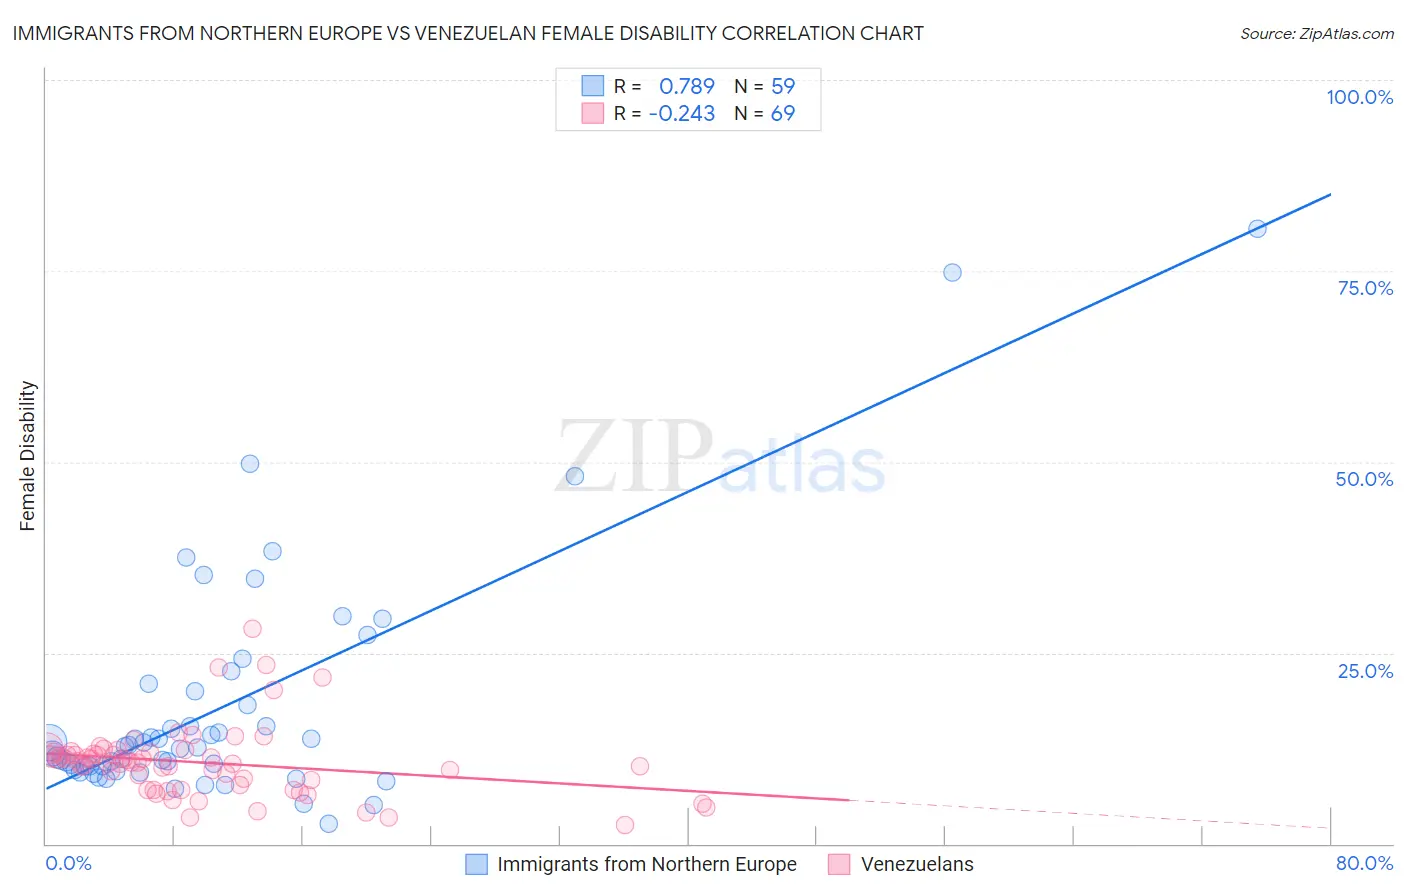
Immigrants from Northern Europe vs Venezuelan Female Disability Correlation Chart
The statistical analysis conducted on geographies consisting of 477,174,714 people shows a strong positive correlation between the proportion of Immigrants from Northern Europe and percentage of females with a disability in the United States with a correlation coefficient (R) of 0.789 and weighted average of 11.6%. Similarly, the statistical analysis conducted on geographies consisting of 306,290,723 people shows a weak negative correlation between the proportion of Venezuelans and percentage of females with a disability in the United States with a correlation coefficient (R) of -0.243 and weighted average of 11.0%, a difference of 6.1%.
Female Disability Correlation Summary
| Measurement | Immigrants from Northern Europe | Venezuelan |
| Minimum | 2.6% | 2.5% |
| Maximum | 80.5% | 28.1% |
| Range | 77.9% | 25.6% |
| Mean | 17.9% | 10.6% |
| Median | 12.6% | 10.7% |
| Interquartile 25% (IQ1) | 9.7% | 7.4% |
| Interquartile 75% (IQ3) | 19.9% | 11.9% |
| Interquartile Range (IQR) | 10.2% | 4.5% |
| Standard Deviation (Sample) | 15.2% | 4.6% |
| Standard Deviation (Population) | 15.1% | 4.6% |
Similar Demographics by Female Disability
Demographics Similar to Immigrants from Northern Europe by Female Disability
In terms of female disability, the demographic groups most similar to Immigrants from Northern Europe are Immigrants from Brazil (11.6%, a difference of 0.070%), Immigrants from Sierra Leone (11.6%, a difference of 0.10%), Immigrants from Czechoslovakia (11.6%, a difference of 0.20%), Immigrants from Romania (11.6%, a difference of 0.21%), and Immigrants from Zimbabwe (11.6%, a difference of 0.21%).
| Demographics | Rating | Rank | Female Disability |
| Yup'ik | 99.5 /100 | #88 | Exceptional 11.6% |
| Vietnamese | 99.5 /100 | #89 | Exceptional 11.6% |
| Immigrants | Romania | 99.5 /100 | #90 | Exceptional 11.6% |
| Immigrants | Zimbabwe | 99.5 /100 | #91 | Exceptional 11.6% |
| Immigrants | Czechoslovakia | 99.5 /100 | #92 | Exceptional 11.6% |
| Immigrants | Sierra Leone | 99.4 /100 | #93 | Exceptional 11.6% |
| Immigrants | Brazil | 99.4 /100 | #94 | Exceptional 11.6% |
| Immigrants | Northern Europe | 99.4 /100 | #95 | Exceptional 11.6% |
| Immigrants | Russia | 99.0 /100 | #96 | Exceptional 11.7% |
| Koreans | 99.0 /100 | #97 | Exceptional 11.7% |
| Uruguayans | 98.8 /100 | #98 | Exceptional 11.7% |
| Immigrants | Philippines | 98.6 /100 | #99 | Exceptional 11.7% |
| Immigrants | Uruguay | 98.5 /100 | #100 | Exceptional 11.7% |
| Immigrants | Costa Rica | 98.4 /100 | #101 | Exceptional 11.7% |
| Immigrants | South Eastern Asia | 98.4 /100 | #102 | Exceptional 11.7% |
Demographics Similar to Venezuelans by Female Disability
In terms of female disability, the demographic groups most similar to Venezuelans are Immigrants from Sri Lanka (10.9%, a difference of 0.22%), Asian (10.9%, a difference of 0.35%), Immigrants from Argentina (11.0%, a difference of 0.57%), Immigrants from Asia (11.0%, a difference of 0.59%), and Argentinean (11.0%, a difference of 0.64%).
| Demographics | Rating | Rank | Female Disability |
| Okinawans | 100.0 /100 | #16 | Exceptional 10.8% |
| Indians (Asian) | 100.0 /100 | #17 | Exceptional 10.8% |
| Immigrants | Iran | 100.0 /100 | #18 | Exceptional 10.8% |
| Immigrants | Venezuela | 100.0 /100 | #19 | Exceptional 10.9% |
| Immigrants | Pakistan | 100.0 /100 | #20 | Exceptional 10.9% |
| Asians | 100.0 /100 | #21 | Exceptional 10.9% |
| Immigrants | Sri Lanka | 100.0 /100 | #22 | Exceptional 10.9% |
| Venezuelans | 100.0 /100 | #23 | Exceptional 11.0% |
| Immigrants | Argentina | 100.0 /100 | #24 | Exceptional 11.0% |
| Immigrants | Asia | 100.0 /100 | #25 | Exceptional 11.0% |
| Argentineans | 100.0 /100 | #26 | Exceptional 11.0% |
| Immigrants | Turkey | 100.0 /100 | #27 | Exceptional 11.1% |
| Egyptians | 100.0 /100 | #28 | Exceptional 11.1% |
| Immigrants | Malaysia | 100.0 /100 | #29 | Exceptional 11.1% |
| Turks | 100.0 /100 | #30 | Exceptional 11.1% |