Immigrants from Northern Europe vs Menominee 5th Grade

COMPARE

Immigrants from Northern Europe
Race
Ancestry
AfghanAfricanAlaska NativeAlaskan AthabascanAlbanianAleutAlsatianAmericanApacheArabArapahoArgentineanArmenianAssyrian/Chaldean/SyriacAustralianAustrianBahamianBangladeshiBarbadianBasqueBelgianBelizeanBermudanBhutaneseBlackfeetBolivianBrazilianBritishBritish West IndianBulgarianBurmeseCajunCambodianCanadianCape VerdeanCarpatho RusynCelticCentral AmericanCentral American IndianCherokeeCheyenneChickasawChileanChineseChippewaChoctawColombianColvilleComancheCosta RicanCreeCreekCroatianCrowCubanCypriotCzechCzechoslovakianDanishDelawareDominicanDutchDutch West IndianEastern EuropeanEcuadorianEgyptianEnglishEstonianEthiopianEuropeanFijianFilipinoFinnishFrenchFrench American IndianFrench CanadianGermanGerman RussianGhanaianGreekGuamanian/ChamorroGuatemalanGuyaneseHaitianHmongHonduranHopiHoumaHungarianIcelanderIndian (Asian)IndonesianInupiatIranianIraqiIrishIroquoisIsraeliItalianJamaicanJapaneseJordanianKenyanKiowaKoreanLaotianLatvianLebaneseLiberianLithuanianLumbeeLuxembourgerMacedonianMalaysianMalteseMarshalleseMexicanMexican American IndianMongolianMoroccanNative HawaiianNavajoNepaleseNew ZealanderNicaraguanNigerianNorthern EuropeanNorwegianOkinawanOsageOttawaPaiutePakistaniPalestinianPanamanianParaguayanPennsylvania GermanPeruvianPimaPolishPortuguesePotawatomiPuebloPuerto RicanPuget Sound SalishRomanianRussianSalvadoranSamoanScandinavianScotch-IrishScottishSeminoleSenegaleseSerbianShoshoneSierra LeoneanSiouxSlavicSlovakSloveneSomaliSouth AfricanSouth AmericanSouth American IndianSoviet UnionSpaniardSpanishSpanish AmericanSpanish American IndianSri LankanSubsaharan AfricanSudaneseSwedishSwissSyrianTaiwaneseThaiTlingit-HaidaTohono O'OdhamTonganTrinidadian and TobagonianTsimshianTurkishU.S. Virgin IslanderUgandanUkrainianUruguayanUteVenezuelanVietnameseWelshWest IndianYakamaYaquiYugoslavianYumanYup'ikZimbabwean
Immigration
NonimmigrantsImmigrantsAfghanistanAfricaAlbaniaArgentinaArmeniaAsiaAustraliaAustriaBahamasBangladeshBarbadosBelarusBelgiumBelizeBoliviaBosnia and HerzegovinaBrazilBulgariaBurma/MyanmarCabo VerdeCambodiaCameroonCanadaCaribbeanCentral AmericaChileChinaColombiaCongoCosta RicaCroatiaCubaCzechoslovakiaDenmarkDominicaDominican RepublicEastern AfricaEastern AsiaEastern EuropeEcuadorEgyptEl SalvadorEnglandEritreaEthiopiaEuropeFijiFranceGermanyGhanaGreeceGrenadaGuatemalaGuyanaHaitiHondurasHong KongHungaryIndiaIndonesiaIranIraqIrelandIsraelItalyJamaicaJapanJordanKazakhstanKenyaKoreaKuwaitLaosLatin AmericaLatviaLebanonLiberiaLithuaniaMalaysiaMexicoMicronesiaMiddle AfricaMoldovaMoroccoNepalNetherlandsNicaraguaNigeriaNorth AmericaNorth MacedoniaNorthern AfricaNorthern EuropeNorwayOceaniaPakistanPanamaPeruPhilippinesPolandPortugalRomaniaRussiaSaudi ArabiaScotlandSenegalSerbiaSierra LeoneSingaporeSomaliaSouth AfricaSouth AmericaSouth Central AsiaSouth Eastern AsiaSouthern EuropeSpainSri LankaSt. Vincent and the GrenadinesSudanSwedenSwitzerlandSyriaTaiwanThailandTrinidad and TobagoTurkeyUgandaUkraineUruguayUzbekistanVenezuelaVietnamWest IndiesWestern AfricaWestern AsiaWestern EuropeYemenZaireZimbabweAzores
Menominee
Race
Ancestry
AfghanAfricanAlaska NativeAlaskan AthabascanAlbanianAleutAlsatianAmericanApacheArabArapahoArgentineanArmenianAssyrian/Chaldean/SyriacAustralianAustrianBahamianBangladeshiBarbadianBasqueBelgianBelizeanBermudanBhutaneseBlackfeetBolivianBrazilianBritishBritish West IndianBulgarianBurmeseCajunCambodianCanadianCape VerdeanCarpatho RusynCelticCentral AmericanCentral American IndianCherokeeCheyenneChickasawChileanChineseChippewaChoctawColombianColvilleComancheCosta RicanCreeCreekCroatianCrowCubanCypriotCzechCzechoslovakianDanishDelawareDominicanDutchDutch West IndianEastern EuropeanEcuadorianEgyptianEnglishEstonianEthiopianEuropeanFijianFilipinoFinnishFrenchFrench American IndianFrench CanadianGermanGerman RussianGhanaianGreekGuamanian/ChamorroGuatemalanGuyaneseHaitianHmongHonduranHopiHoumaHungarianIcelanderIndian (Asian)IndonesianInupiatIranianIraqiIrishIroquoisIsraeliItalianJamaicanJapaneseJordanianKenyanKiowaKoreanLaotianLatvianLebaneseLiberianLithuanianLumbeeLuxembourgerMacedonianMalaysianMalteseMarshalleseMenomineeMexicanMexican American IndianMongolianMoroccanNative HawaiianNavajoNepaleseNew ZealanderNicaraguanNigerianNorthern EuropeanNorwegianOkinawanOsageOttawaPaiutePakistaniPalestinianPanamanianParaguayanPennsylvania GermanPeruvianPimaPolishPortuguesePotawatomiPuebloPuerto RicanPuget Sound SalishRomanianRussianSalvadoranSamoanScandinavianScotch-IrishScottishSeminoleSenegaleseSerbianShoshoneSierra LeoneanSiouxSlavicSlovakSloveneSomaliSouth AfricanSouth AmericanSouth American IndianSoviet UnionSpaniardSpanishSpanish AmericanSpanish American IndianSri LankanSubsaharan AfricanSudaneseSwedishSwissSyrianTaiwaneseThaiTlingit-HaidaTohono O'OdhamTonganTrinidadian and TobagonianTsimshianTurkishU.S. Virgin IslanderUgandanUkrainianUruguayanUteVenezuelanVietnameseWelshWest IndianYakamaYaquiYugoslavianYumanYup'ikZimbabwean
Immigration
NonimmigrantsImmigrantsAfghanistanAfricaAlbaniaArgentinaArmeniaAsiaAustraliaAustriaBahamasBangladeshBarbadosBelarusBelgiumBelizeBoliviaBosnia and HerzegovinaBrazilBulgariaBurma/MyanmarCabo VerdeCambodiaCameroonCanadaCaribbeanCentral AmericaChileChinaColombiaCongoCosta RicaCroatiaCubaCzechoslovakiaDenmarkDominicaDominican RepublicEastern AfricaEastern AsiaEastern EuropeEcuadorEgyptEl SalvadorEnglandEritreaEthiopiaEuropeFijiFranceGermanyGhanaGreeceGrenadaGuatemalaGuyanaHaitiHondurasHong KongHungaryIndiaIndonesiaIranIraqIrelandIsraelItalyJamaicaJapanJordanKazakhstanKenyaKoreaKuwaitLaosLatin AmericaLatviaLebanonLiberiaLithuaniaMalaysiaMexicoMicronesiaMiddle AfricaMoldovaMoroccoNepalNetherlandsNicaraguaNigeriaNorth AmericaNorth MacedoniaNorthern AfricaNorwayOceaniaPakistanPanamaPeruPhilippinesPolandPortugalRomaniaRussiaSaudi ArabiaScotlandSenegalSerbiaSierra LeoneSingaporeSomaliaSouth AfricaSouth AmericaSouth Central AsiaSouth Eastern AsiaSouthern EuropeSpainSri LankaSt. Vincent and the GrenadinesSudanSwedenSwitzerlandSyriaTaiwanThailandTrinidad and TobagoTurkeyUgandaUkraineUruguayUzbekistanVenezuelaVietnamWest IndiesWestern AfricaWestern AsiaWestern EuropeYemenZaireZimbabweAzores
5th Grade
Income
Poverty
Unemployment
Labor Participation
Family Structure
Vehicle Availability
Education Level
Disability

5th Grade Comparison

Immigrants from Northern Europe

Menominee

Exceptional
Exceptional
97.9%
5TH GRADE
99.6/ 100
METRIC RATING
64th/ 347
METRIC RANK
97.7%
5TH GRADE
96.3/ 100
METRIC RATING
111th/ 347
METRIC RANK

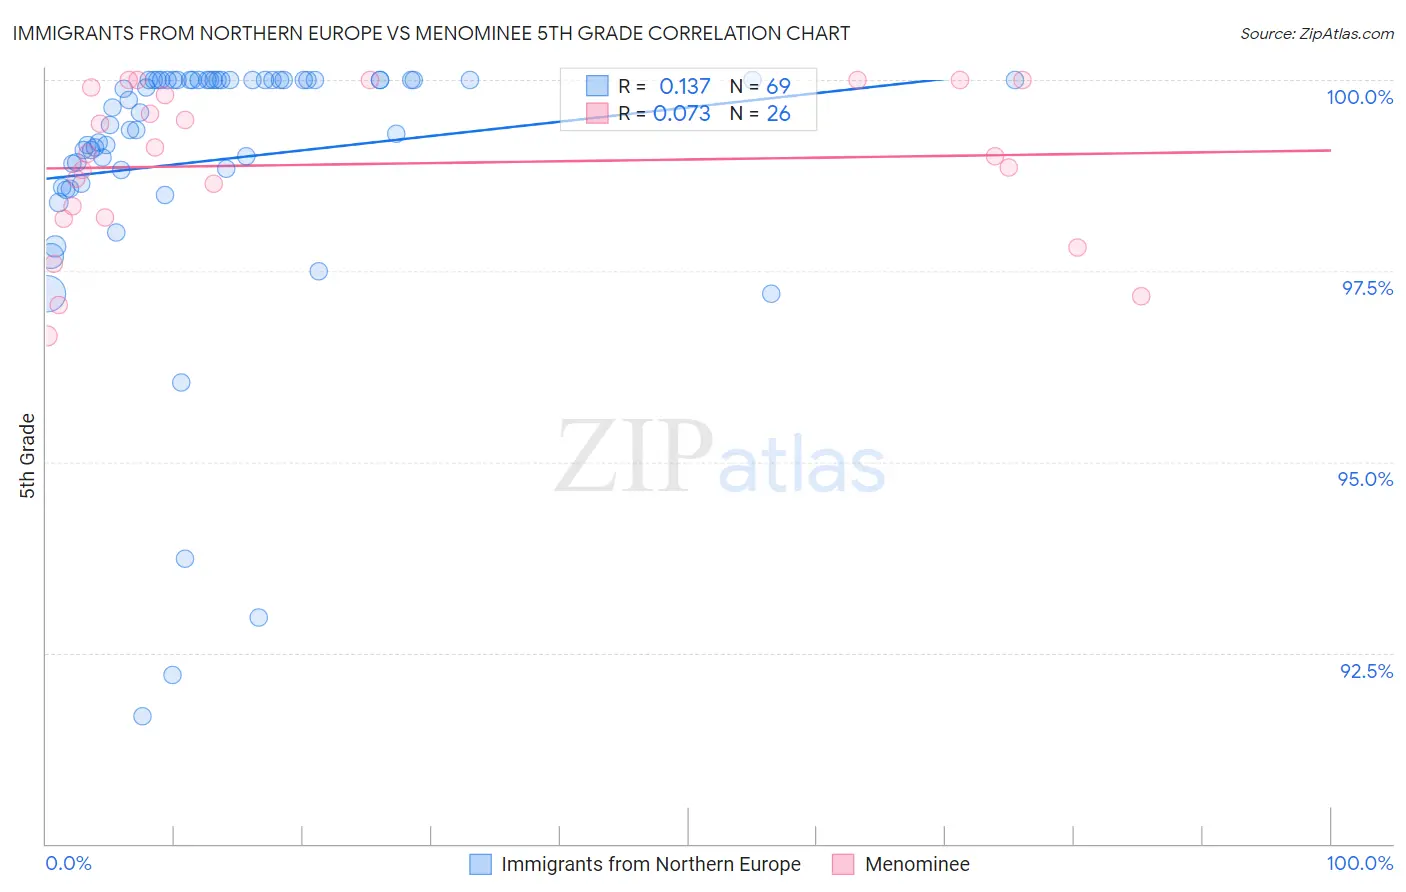
Immigrants from Northern Europe vs Menominee 5th Grade Correlation Chart

The statistical analysis conducted on geographies consisting of 477,226,800 people shows a poor positive correlation between the proportion of Immigrants from Northern Europe and percentage of population with at least 5th grade education in the United States with a correlation coefficient (R) of 0.137 and weighted average of 97.9%. Similarly, the statistical analysis conducted on geographies consisting of 45,778,979 people shows a slight positive correlation between the proportion of Menominee and percentage of population with at least 5th grade education in the United States with a correlation coefficient (R) of 0.073 and weighted average of 97.7%, a difference of 0.24%.
Immigrants from Northern Europe vs Menominee 5th Grade

5th Grade Correlation Summary

MeasurementImmigrants from Northern EuropeMenominee
Minimum91.7%96.6%
Maximum100.0%100.0%
Range8.3%3.4%
Mean99.0%98.9%
Median99.6%99.0%
Interquartile 25% (IQ1)98.7%98.2%
Interquartile 75% (IQ3)100.0%99.9%
Interquartile Range (IQR)1.3%1.7%
Standard Deviation (Sample)1.8%1.0%
Standard Deviation (Population)1.8%1.00%

Similar Demographics by 5th Grade

Demographics Similar to Immigrants from Northern Europe by 5th Grade

In terms of 5th grade, the demographic groups most similar to Immigrants from Northern Europe are Canadian (97.9%, a difference of 0.0%), Immigrants from Austria (97.9%, a difference of 0.010%), New Zealander (97.9%, a difference of 0.010%), Serbian (97.9%, a difference of 0.020%), and Immigrants from North America (97.9%, a difference of 0.020%).
DemographicsRating | Rank5th Grade
Austrians
99.8
/100
|
#57
Exceptional
97.9%
Whites/Caucasians
99.8
/100
|
#58
Exceptional
97.9%
Americans
99.7
/100
|
#59
Exceptional
97.9%
Immigrants | Canada
99.7
/100
|
#60
Exceptional
97.9%
Serbians
99.7
/100
|
#61
Exceptional
97.9%
Immigrants | North America
99.7
/100
|
#62
Exceptional
97.9%
Russians
99.7
/100
|
#63
Exceptional
97.9%
Immigrants | Northern Europe
99.6
/100
|
#64
Exceptional
97.9%
Canadians
99.6
/100
|
#65
Exceptional
97.9%
Immigrants | Austria
99.6
/100
|
#66
Exceptional
97.9%
New Zealanders
99.6
/100
|
#67
Exceptional
97.9%
Cajuns
99.6
/100
|
#68
Exceptional
97.9%
Kiowa
99.5
/100
|
#69
Exceptional
97.9%
Iranians
99.5
/100
|
#70
Exceptional
97.9%
Chickasaw
99.5
/100
|
#71
Exceptional
97.9%

Demographics Similar to Menominee by 5th Grade

In terms of 5th grade, the demographic groups most similar to Menominee are Immigrants from Switzerland (97.7%, a difference of 0.010%), Iroquois (97.7%, a difference of 0.010%), Immigrants from Latvia (97.7%, a difference of 0.020%), Thai (97.7%, a difference of 0.020%), and Lebanese (97.6%, a difference of 0.020%).
DemographicsRating | Rank5th Grade
German Russians
97.8
/100
|
#104
Exceptional
97.7%
Bhutanese
97.6
/100
|
#105
Exceptional
97.7%
Immigrants | Czechoslovakia
97.5
/100
|
#106
Exceptional
97.7%
Immigrants | Singapore
97.5
/100
|
#107
Exceptional
97.7%
Immigrants | Nonimmigrants
97.3
/100
|
#108
Exceptional
97.7%
Immigrants | Latvia
97.1
/100
|
#109
Exceptional
97.7%
Thais
96.9
/100
|
#110
Exceptional
97.7%
Menominee
96.3
/100
|
#111
Exceptional
97.7%
Immigrants | Switzerland
96.0
/100
|
#112
Exceptional
97.7%
Iroquois
95.9
/100
|
#113
Exceptional
97.7%
Lebanese
95.7
/100
|
#114
Exceptional
97.6%
Okinawans
95.7
/100
|
#115
Exceptional
97.6%
Immigrants | Croatia
95.5
/100
|
#116
Exceptional
97.6%
Immigrants | Saudi Arabia
95.4
/100
|
#117
Exceptional
97.6%
Basques
95.2
/100
|
#118
Exceptional
97.6%