Immigrants from Northern Europe vs Immigrants from Belgium Master's Degree
COMPARE
Immigrants from Northern Europe
Immigrants from Belgium
Master's Degree
Master's Degree Comparison
Immigrants from Northern Europe
Immigrants from Belgium
19.5%
MASTER'S DEGREE
100.0/ 100
METRIC RATING
35th/ 347
METRIC RANK
20.8%
MASTER'S DEGREE
100.0/ 100
METRIC RATING
16th/ 347
METRIC RANK
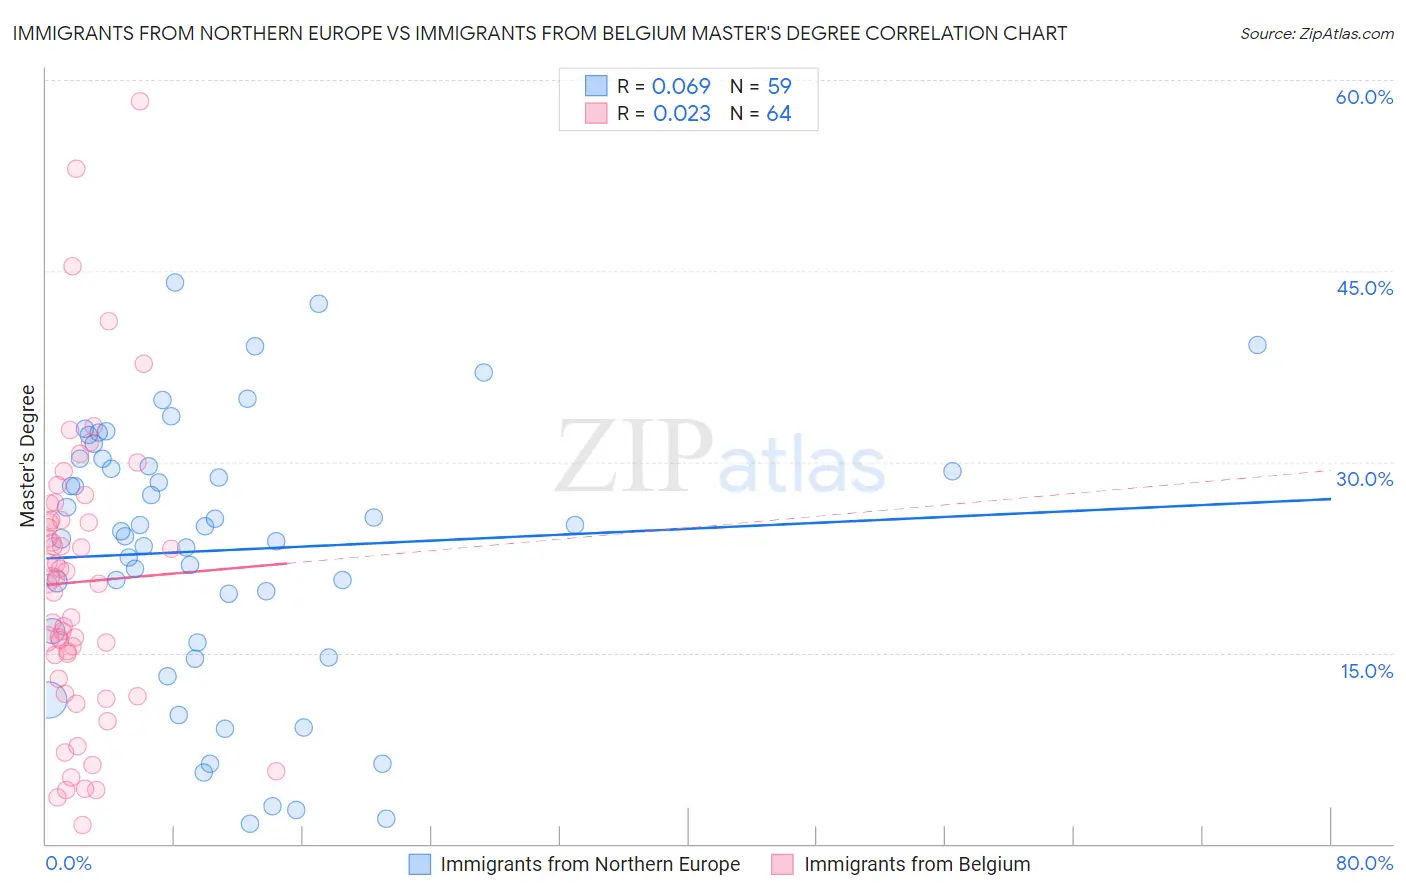
Immigrants from Northern Europe vs Immigrants from Belgium Master's Degree Correlation Chart
The statistical analysis conducted on geographies consisting of 477,052,190 people shows a slight positive correlation between the proportion of Immigrants from Northern Europe and percentage of population with at least master's degree education in the United States with a correlation coefficient (R) of 0.069 and weighted average of 19.5%. Similarly, the statistical analysis conducted on geographies consisting of 146,699,355 people shows no correlation between the proportion of Immigrants from Belgium and percentage of population with at least master's degree education in the United States with a correlation coefficient (R) of 0.023 and weighted average of 20.8%, a difference of 6.6%.
Master's Degree Correlation Summary
| Measurement | Immigrants from Northern Europe | Immigrants from Belgium |
| Minimum | 1.5% | 1.5% |
| Maximum | 44.1% | 58.3% |
| Range | 42.6% | 56.8% |
| Mean | 23.1% | 20.6% |
| Median | 24.6% | 20.7% |
| Interquartile 25% (IQ1) | 15.8% | 13.9% |
| Interquartile 75% (IQ3) | 30.2% | 25.4% |
| Interquartile Range (IQR) | 14.4% | 11.5% |
| Standard Deviation (Sample) | 10.5% | 11.3% |
| Standard Deviation (Population) | 10.4% | 11.2% |
Demographics Similar to Immigrants from Northern Europe and Immigrants from Belgium by Master's Degree
In terms of master's degree, the demographic groups most similar to Immigrants from Northern Europe are Immigrants from Denmark (19.5%, a difference of 0.33%), Russian (19.5%, a difference of 0.36%), Burmese (19.7%, a difference of 1.1%), Immigrants from Korea (19.7%, a difference of 1.2%), and Immigrants from Turkey (19.7%, a difference of 1.2%). Similarly, the demographic groups most similar to Immigrants from Belgium are Immigrants from South Central Asia (20.7%, a difference of 0.26%), Immigrants from Eastern Asia (20.8%, a difference of 0.29%), Soviet Union (20.5%, a difference of 1.2%), Immigrants from Hong Kong (20.5%, a difference of 1.5%), and Indian (Asian) (20.5%, a difference of 1.5%).
| Demographics | Rating | Rank | Master's Degree |
| Immigrants | Eastern Asia | 100.0 /100 | #15 | Exceptional 20.8% |
| Immigrants | Belgium | 100.0 /100 | #16 | Exceptional 20.8% |
| Immigrants | South Central Asia | 100.0 /100 | #17 | Exceptional 20.7% |
| Soviet Union | 100.0 /100 | #18 | Exceptional 20.5% |
| Immigrants | Hong Kong | 100.0 /100 | #19 | Exceptional 20.5% |
| Indians (Asian) | 100.0 /100 | #20 | Exceptional 20.5% |
| Immigrants | Ireland | 100.0 /100 | #21 | Exceptional 20.4% |
| Israelis | 100.0 /100 | #22 | Exceptional 20.3% |
| Immigrants | France | 100.0 /100 | #23 | Exceptional 20.3% |
| Immigrants | Sweden | 100.0 /100 | #24 | Exceptional 20.3% |
| Immigrants | Japan | 100.0 /100 | #25 | Exceptional 20.0% |
| Cambodians | 100.0 /100 | #26 | Exceptional 20.0% |
| Immigrants | Sri Lanka | 100.0 /100 | #27 | Exceptional 19.9% |
| Turks | 100.0 /100 | #28 | Exceptional 19.9% |
| Latvians | 100.0 /100 | #29 | Exceptional 19.8% |
| Immigrants | Turkey | 100.0 /100 | #30 | Exceptional 19.7% |
| Immigrants | Korea | 100.0 /100 | #31 | Exceptional 19.7% |
| Burmese | 100.0 /100 | #32 | Exceptional 19.7% |
| Russians | 100.0 /100 | #33 | Exceptional 19.5% |
| Immigrants | Denmark | 100.0 /100 | #34 | Exceptional 19.5% |
| Immigrants | Northern Europe | 100.0 /100 | #35 | Exceptional 19.5% |