Immigrants from Northern Africa vs Immigrants from Belgium Master's Degree
COMPARE
Immigrants from Northern Africa
Immigrants from Belgium
Master's Degree
Master's Degree Comparison
Immigrants from Northern Africa
Immigrants from Belgium
17.1%
MASTER'S DEGREE
98.9/ 100
METRIC RATING
96th/ 347
METRIC RANK
20.8%
MASTER'S DEGREE
100.0/ 100
METRIC RATING
16th/ 347
METRIC RANK
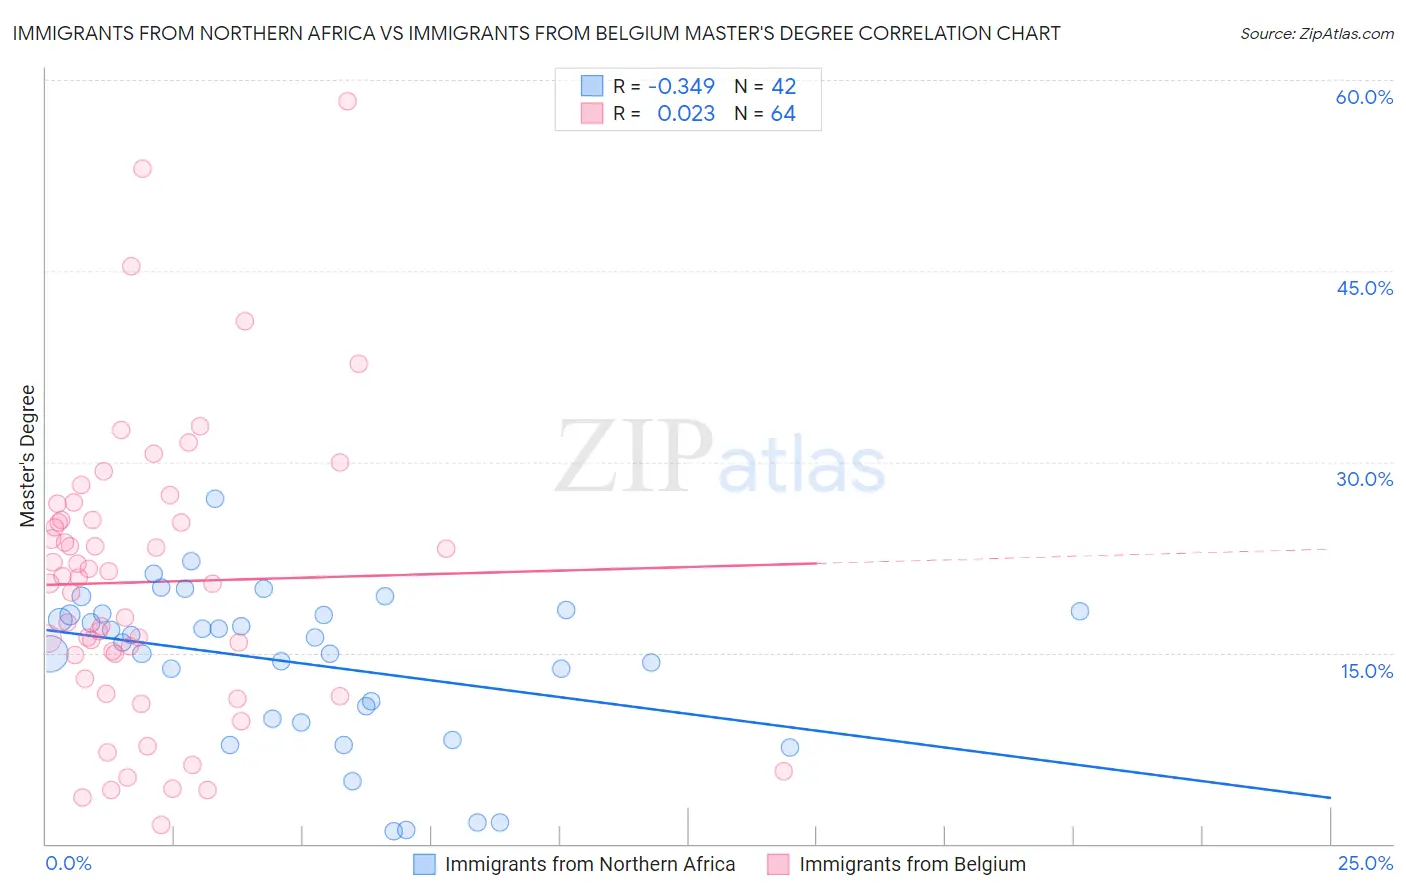
Immigrants from Northern Africa vs Immigrants from Belgium Master's Degree Correlation Chart
The statistical analysis conducted on geographies consisting of 321,156,362 people shows a mild negative correlation between the proportion of Immigrants from Northern Africa and percentage of population with at least master's degree education in the United States with a correlation coefficient (R) of -0.349 and weighted average of 17.1%. Similarly, the statistical analysis conducted on geographies consisting of 146,699,355 people shows no correlation between the proportion of Immigrants from Belgium and percentage of population with at least master's degree education in the United States with a correlation coefficient (R) of 0.023 and weighted average of 20.8%, a difference of 21.6%.
Master's Degree Correlation Summary
| Measurement | Immigrants from Northern Africa | Immigrants from Belgium |
| Minimum | 1.0% | 1.5% |
| Maximum | 27.1% | 58.3% |
| Range | 26.1% | 56.8% |
| Mean | 14.2% | 20.6% |
| Median | 16.0% | 20.7% |
| Interquartile 25% (IQ1) | 9.8% | 13.9% |
| Interquartile 75% (IQ3) | 18.1% | 25.4% |
| Interquartile Range (IQR) | 8.2% | 11.5% |
| Standard Deviation (Sample) | 6.1% | 11.3% |
| Standard Deviation (Population) | 6.1% | 11.2% |
Similar Demographics by Master's Degree
Demographics Similar to Immigrants from Northern Africa by Master's Degree
In terms of master's degree, the demographic groups most similar to Immigrants from Northern Africa are Immigrants from Morocco (17.1%, a difference of 0.030%), Immigrants from England (17.0%, a difference of 0.16%), Immigrants from Ukraine (17.0%, a difference of 0.26%), Laotian (17.0%, a difference of 0.32%), and Ugandan (17.1%, a difference of 0.34%).
| Demographics | Rating | Rank | Master's Degree |
| Bhutanese | 99.1 /100 | #89 | Exceptional 17.2% |
| Immigrants | Egypt | 99.1 /100 | #90 | Exceptional 17.2% |
| Romanians | 99.1 /100 | #91 | Exceptional 17.2% |
| Immigrants | North America | 99.1 /100 | #92 | Exceptional 17.2% |
| Immigrants | Italy | 99.1 /100 | #93 | Exceptional 17.2% |
| Ugandans | 99.0 /100 | #94 | Exceptional 17.1% |
| Immigrants | Morocco | 98.9 /100 | #95 | Exceptional 17.1% |
| Immigrants | Northern Africa | 98.9 /100 | #96 | Exceptional 17.1% |
| Immigrants | England | 98.8 /100 | #97 | Exceptional 17.0% |
| Immigrants | Ukraine | 98.8 /100 | #98 | Exceptional 17.0% |
| Laotians | 98.8 /100 | #99 | Exceptional 17.0% |
| Albanians | 98.7 /100 | #100 | Exceptional 17.0% |
| Immigrants | Nepal | 98.6 /100 | #101 | Exceptional 17.0% |
| Chileans | 98.6 /100 | #102 | Exceptional 16.9% |
| Alsatians | 98.4 /100 | #103 | Exceptional 16.9% |
Demographics Similar to Immigrants from Belgium by Master's Degree
In terms of master's degree, the demographic groups most similar to Immigrants from Belgium are Immigrants from South Central Asia (20.7%, a difference of 0.26%), Immigrants from Eastern Asia (20.8%, a difference of 0.29%), Immigrants from Switzerland (20.9%, a difference of 0.47%), Immigrants from Australia (20.9%, a difference of 0.48%), and Soviet Union (20.5%, a difference of 1.2%).
| Demographics | Rating | Rank | Master's Degree |
| Thais | 100.0 /100 | #9 | Exceptional 21.7% |
| Immigrants | Iran | 100.0 /100 | #10 | Exceptional 21.6% |
| Immigrants | China | 100.0 /100 | #11 | Exceptional 21.2% |
| Eastern Europeans | 100.0 /100 | #12 | Exceptional 21.1% |
| Immigrants | Australia | 100.0 /100 | #13 | Exceptional 20.9% |
| Immigrants | Switzerland | 100.0 /100 | #14 | Exceptional 20.9% |
| Immigrants | Eastern Asia | 100.0 /100 | #15 | Exceptional 20.8% |
| Immigrants | Belgium | 100.0 /100 | #16 | Exceptional 20.8% |
| Immigrants | South Central Asia | 100.0 /100 | #17 | Exceptional 20.7% |
| Soviet Union | 100.0 /100 | #18 | Exceptional 20.5% |
| Immigrants | Hong Kong | 100.0 /100 | #19 | Exceptional 20.5% |
| Indians (Asian) | 100.0 /100 | #20 | Exceptional 20.5% |
| Immigrants | Ireland | 100.0 /100 | #21 | Exceptional 20.4% |
| Israelis | 100.0 /100 | #22 | Exceptional 20.3% |
| Immigrants | France | 100.0 /100 | #23 | Exceptional 20.3% |