Immigrants from Northern Africa vs Belgian High School Diploma
COMPARE
Immigrants from Northern Africa
Belgian
High School Diploma
High School Diploma Comparison
Immigrants from Northern Africa
Belgians
89.4%
HIGH SCHOOL DIPLOMA
66.4/ 100
METRIC RATING
155th/ 347
METRIC RANK
91.2%
HIGH SCHOOL DIPLOMA
99.8/ 100
METRIC RATING
48th/ 347
METRIC RANK
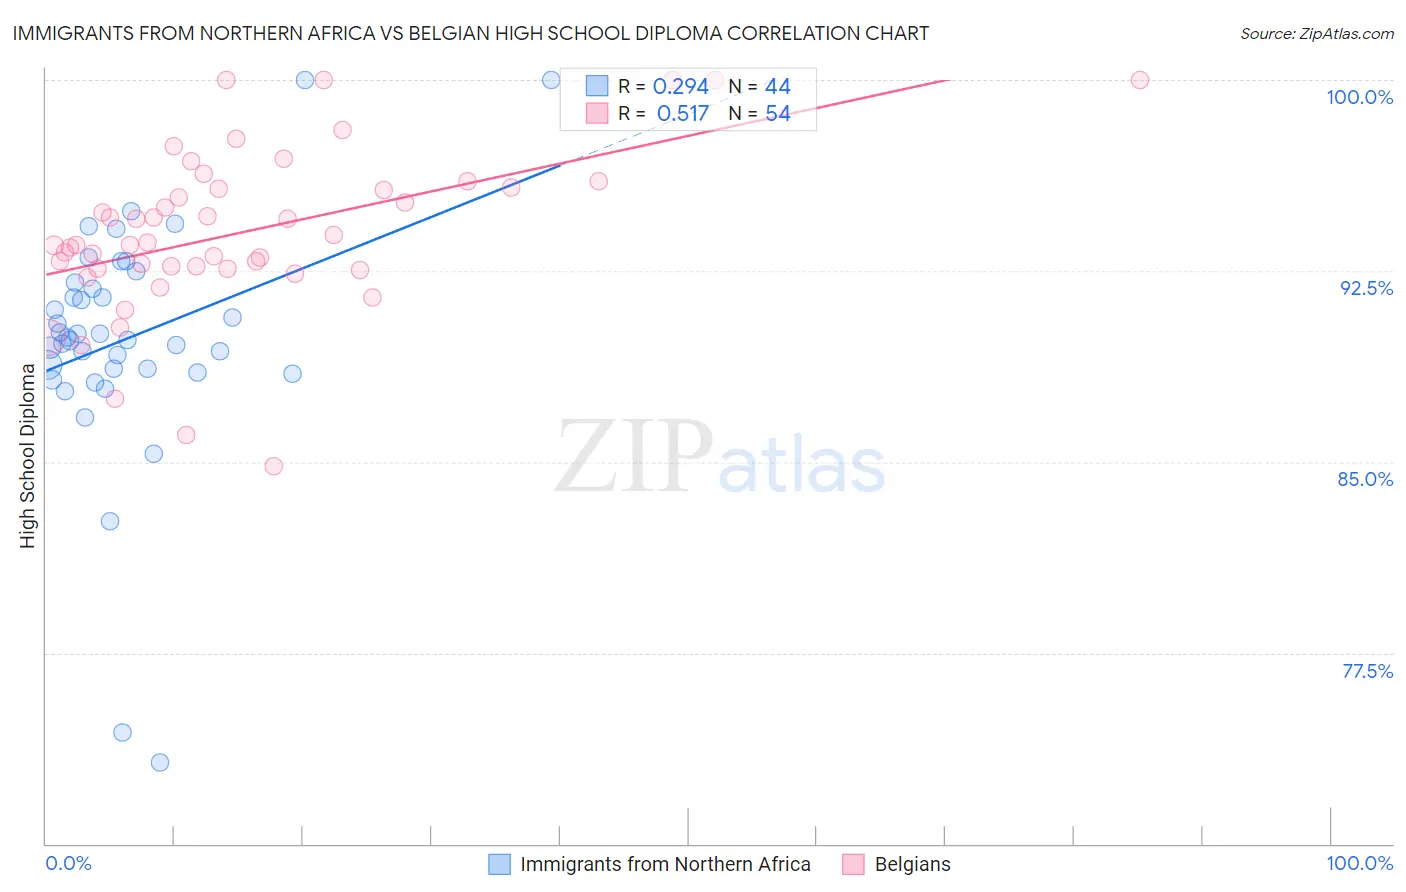
Immigrants from Northern Africa vs Belgian High School Diploma Correlation Chart
The statistical analysis conducted on geographies consisting of 321,196,768 people shows a weak positive correlation between the proportion of Immigrants from Northern Africa and percentage of population with at least high school diploma education in the United States with a correlation coefficient (R) of 0.294 and weighted average of 89.4%. Similarly, the statistical analysis conducted on geographies consisting of 356,019,518 people shows a substantial positive correlation between the proportion of Belgians and percentage of population with at least high school diploma education in the United States with a correlation coefficient (R) of 0.517 and weighted average of 91.2%, a difference of 2.1%.
High School Diploma Correlation Summary
| Measurement | Immigrants from Northern Africa | Belgian |
| Minimum | 73.2% | 84.8% |
| Maximum | 100.0% | 100.0% |
| Range | 26.8% | 15.2% |
| Mean | 89.8% | 94.0% |
| Median | 89.8% | 93.6% |
| Interquartile 25% (IQ1) | 88.6% | 92.6% |
| Interquartile 75% (IQ3) | 91.9% | 95.8% |
| Interquartile Range (IQR) | 3.3% | 3.2% |
| Standard Deviation (Sample) | 4.7% | 3.2% |
| Standard Deviation (Population) | 4.7% | 3.2% |
Similar Demographics by High School Diploma
Demographics Similar to Immigrants from Northern Africa by High School Diploma
In terms of high school diploma, the demographic groups most similar to Immigrants from Northern Africa are Alsatian (89.4%, a difference of 0.010%), Immigrants from Argentina (89.4%, a difference of 0.020%), Immigrants from Iraq (89.4%, a difference of 0.040%), Immigrants from Malaysia (89.3%, a difference of 0.050%), and Immigrants from Pakistan (89.3%, a difference of 0.060%).
| Demographics | Rating | Rank | High School Diploma |
| Immigrants | Lebanon | 73.4 /100 | #148 | Good 89.5% |
| Immigrants | Poland | 72.9 /100 | #149 | Good 89.5% |
| Argentineans | 72.3 /100 | #150 | Good 89.5% |
| Paraguayans | 71.4 /100 | #151 | Good 89.5% |
| Asians | 70.7 /100 | #152 | Good 89.4% |
| Immigrants | Iraq | 68.7 /100 | #153 | Good 89.4% |
| Alsatians | 66.8 /100 | #154 | Good 89.4% |
| Immigrants | Northern Africa | 66.4 /100 | #155 | Good 89.4% |
| Immigrants | Argentina | 65.5 /100 | #156 | Good 89.4% |
| Immigrants | Malaysia | 63.5 /100 | #157 | Good 89.3% |
| Immigrants | Pakistan | 62.5 /100 | #158 | Good 89.3% |
| Immigrants | China | 62.0 /100 | #159 | Good 89.3% |
| Laotians | 61.8 /100 | #160 | Good 89.3% |
| Brazilians | 61.2 /100 | #161 | Good 89.3% |
| Bermudans | 61.1 /100 | #162 | Good 89.3% |
Demographics Similar to Belgians by High School Diploma
In terms of high school diploma, the demographic groups most similar to Belgians are Australian (91.2%, a difference of 0.0%), Bhutanese (91.2%, a difference of 0.010%), Greek (91.2%, a difference of 0.020%), Welsh (91.2%, a difference of 0.030%), and Immigrants from Austria (91.3%, a difference of 0.050%).
| Demographics | Rating | Rank | High School Diploma |
| Immigrants | Australia | 99.8 /100 | #41 | Exceptional 91.3% |
| Northern Europeans | 99.8 /100 | #42 | Exceptional 91.3% |
| British | 99.8 /100 | #43 | Exceptional 91.3% |
| Immigrants | Austria | 99.8 /100 | #44 | Exceptional 91.3% |
| Turks | 99.8 /100 | #45 | Exceptional 91.2% |
| Greeks | 99.8 /100 | #46 | Exceptional 91.2% |
| Australians | 99.8 /100 | #47 | Exceptional 91.2% |
| Belgians | 99.8 /100 | #48 | Exceptional 91.2% |
| Bhutanese | 99.8 /100 | #49 | Exceptional 91.2% |
| Welsh | 99.8 /100 | #50 | Exceptional 91.2% |
| New Zealanders | 99.7 /100 | #51 | Exceptional 91.1% |
| Immigrants | Sweden | 99.7 /100 | #52 | Exceptional 91.1% |
| Immigrants | Belgium | 99.7 /100 | #53 | Exceptional 91.1% |
| Macedonians | 99.7 /100 | #54 | Exceptional 91.1% |
| Serbians | 99.7 /100 | #55 | Exceptional 91.1% |