Immigrants from Serbia vs Choctaw 3rd Grade
COMPARE
Immigrants from Serbia
Choctaw
3rd Grade
3rd Grade Comparison
Immigrants from Serbia
Choctaw
98.0%
3RD GRADE
91.9/ 100
METRIC RATING
129th/ 347
METRIC RANK
98.1%
3RD GRADE
98.0/ 100
METRIC RATING
98th/ 347
METRIC RANK
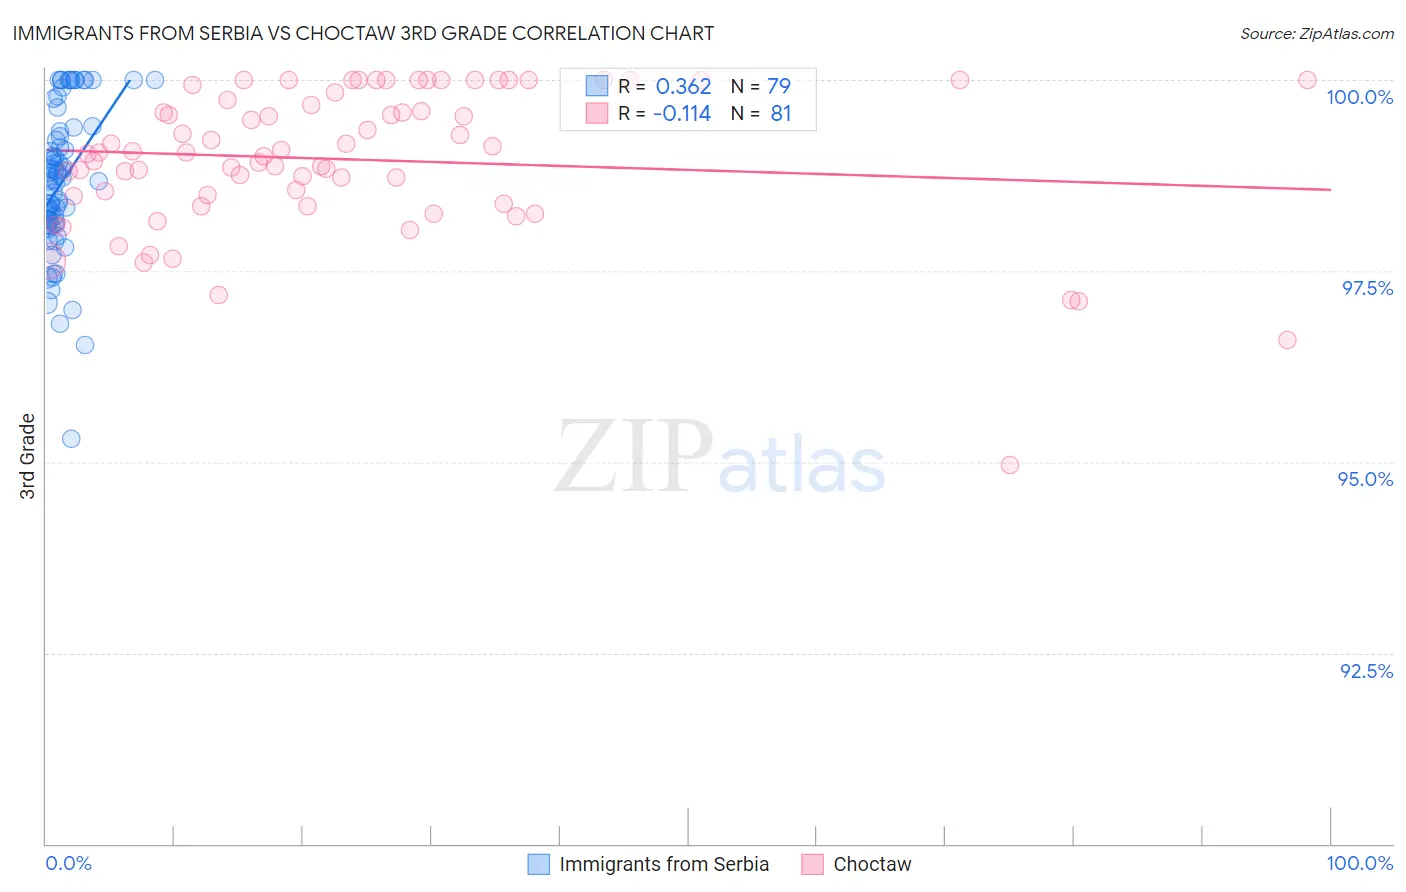
Immigrants from Serbia vs Choctaw 3rd Grade Correlation Chart
The statistical analysis conducted on geographies consisting of 131,729,423 people shows a mild positive correlation between the proportion of Immigrants from Serbia and percentage of population with at least 3rd grade education in the United States with a correlation coefficient (R) of 0.362 and weighted average of 98.0%. Similarly, the statistical analysis conducted on geographies consisting of 269,742,875 people shows a poor negative correlation between the proportion of Choctaw and percentage of population with at least 3rd grade education in the United States with a correlation coefficient (R) of -0.114 and weighted average of 98.1%, a difference of 0.13%.
3rd Grade Correlation Summary
| Measurement | Immigrants from Serbia | Choctaw |
| Minimum | 95.3% | 95.0% |
| Maximum | 100.0% | 100.0% |
| Range | 4.7% | 5.0% |
| Mean | 98.7% | 99.0% |
| Median | 98.7% | 99.1% |
| Interquartile 25% (IQ1) | 98.1% | 98.4% |
| Interquartile 75% (IQ3) | 99.3% | 99.8% |
| Interquartile Range (IQR) | 1.2% | 1.4% |
| Standard Deviation (Sample) | 0.96% | 0.95% |
| Standard Deviation (Population) | 0.95% | 0.94% |
Similar Demographics by 3rd Grade
Demographics Similar to Immigrants from Serbia by 3rd Grade
In terms of 3rd grade, the demographic groups most similar to Immigrants from Serbia are Colville (98.0%, a difference of 0.0%), Immigrants from Europe (98.0%, a difference of 0.010%), Syrian (98.0%, a difference of 0.020%), Immigrants from Japan (98.0%, a difference of 0.020%), and Immigrants from Saudi Arabia (98.0%, a difference of 0.020%).
| Demographics | Rating | Rank | 3rd Grade |
| Lebanese | 94.1 /100 | #122 | Exceptional 98.0% |
| Syrians | 93.8 /100 | #123 | Exceptional 98.0% |
| Immigrants | Japan | 93.7 /100 | #124 | Exceptional 98.0% |
| Immigrants | Saudi Arabia | 93.5 /100 | #125 | Exceptional 98.0% |
| Immigrants | Zimbabwe | 93.4 /100 | #126 | Exceptional 98.0% |
| Ute | 93.2 /100 | #127 | Exceptional 98.0% |
| Colville | 92.1 /100 | #128 | Exceptional 98.0% |
| Immigrants | Serbia | 91.9 /100 | #129 | Exceptional 98.0% |
| Immigrants | Europe | 91.2 /100 | #130 | Exceptional 98.0% |
| Immigrants | Bulgaria | 89.1 /100 | #131 | Excellent 97.9% |
| Immigrants | Hungary | 88.8 /100 | #132 | Excellent 97.9% |
| Immigrants | Kuwait | 88.7 /100 | #133 | Excellent 97.9% |
| Seminole | 88.7 /100 | #134 | Excellent 97.9% |
| Cambodians | 88.1 /100 | #135 | Excellent 97.9% |
| Spaniards | 87.9 /100 | #136 | Excellent 97.9% |
Demographics Similar to Choctaw by 3rd Grade
In terms of 3rd grade, the demographic groups most similar to Choctaw are Romanian (98.1%, a difference of 0.0%), Cree (98.1%, a difference of 0.0%), Immigrants from Ireland (98.1%, a difference of 0.010%), South African (98.1%, a difference of 0.010%), and Puget Sound Salish (98.1%, a difference of 0.010%).
| Demographics | Rating | Rank | 3rd Grade |
| Hopi | 98.7 /100 | #91 | Exceptional 98.1% |
| Immigrants | South Africa | 98.7 /100 | #92 | Exceptional 98.1% |
| Immigrants | Western Europe | 98.7 /100 | #93 | Exceptional 98.1% |
| Immigrants | Germany | 98.4 /100 | #94 | Exceptional 98.1% |
| Cypriots | 98.4 /100 | #95 | Exceptional 98.1% |
| Immigrants | Ireland | 98.2 /100 | #96 | Exceptional 98.1% |
| South Africans | 98.2 /100 | #97 | Exceptional 98.1% |
| Choctaw | 98.0 /100 | #98 | Exceptional 98.1% |
| Romanians | 98.0 /100 | #99 | Exceptional 98.1% |
| Cree | 97.9 /100 | #100 | Exceptional 98.1% |
| Puget Sound Salish | 97.9 /100 | #101 | Exceptional 98.1% |
| Immigrants | Nonimmigrants | 97.8 /100 | #102 | Exceptional 98.1% |
| Yugoslavians | 97.7 /100 | #103 | Exceptional 98.1% |
| Turks | 97.6 /100 | #104 | Exceptional 98.1% |
| German Russians | 97.2 /100 | #105 | Exceptional 98.1% |