Immigrants from Bulgaria vs Croatian 6th Grade
COMPARE
Immigrants from Bulgaria
Croatian
6th Grade
6th Grade Comparison
Immigrants from Bulgaria
Croatians
97.3%
6TH GRADE
93.6/ 100
METRIC RATING
126th/ 347
METRIC RANK
98.0%
6TH GRADE
100.0/ 100
METRIC RATING
24th/ 347
METRIC RANK
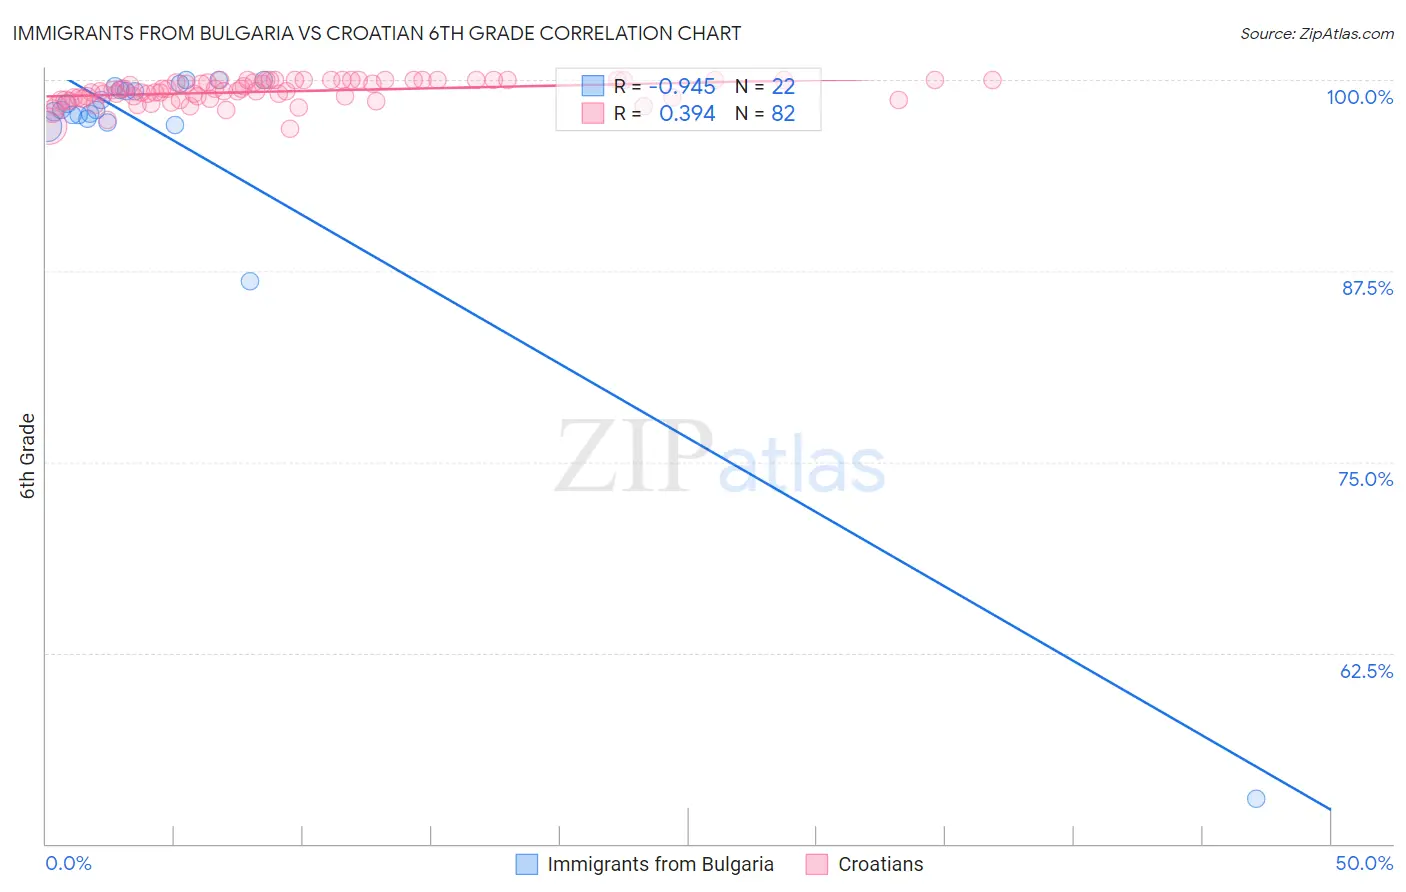
Immigrants from Bulgaria vs Croatian 6th Grade Correlation Chart
The statistical analysis conducted on geographies consisting of 172,552,181 people shows a near-perfect negative correlation between the proportion of Immigrants from Bulgaria and percentage of population with at least 6th grade education in the United States with a correlation coefficient (R) of -0.945 and weighted average of 97.3%. Similarly, the statistical analysis conducted on geographies consisting of 375,733,612 people shows a mild positive correlation between the proportion of Croatians and percentage of population with at least 6th grade education in the United States with a correlation coefficient (R) of 0.394 and weighted average of 98.0%, a difference of 0.71%.
6th Grade Correlation Summary
| Measurement | Immigrants from Bulgaria | Croatian |
| Minimum | 52.9% | 96.8% |
| Maximum | 100.0% | 100.0% |
| Range | 47.1% | 3.2% |
| Mean | 95.9% | 99.2% |
| Median | 98.0% | 99.3% |
| Interquartile 25% (IQ1) | 97.5% | 98.8% |
| Interquartile 75% (IQ3) | 99.4% | 100.0% |
| Interquartile Range (IQR) | 1.9% | 1.2% |
| Standard Deviation (Sample) | 10.0% | 0.74% |
| Standard Deviation (Population) | 9.7% | 0.73% |
Similar Demographics by 6th Grade
Demographics Similar to Immigrants from Bulgaria by 6th Grade
In terms of 6th grade, the demographic groups most similar to Immigrants from Bulgaria are Spanish (97.3%, a difference of 0.0%), Okinawan (97.4%, a difference of 0.010%), Immigrants from Croatia (97.3%, a difference of 0.010%), Immigrants from Norway (97.4%, a difference of 0.020%), and Immigrants from France (97.4%, a difference of 0.020%).
| Demographics | Rating | Rank | 6th Grade |
| Immigrants | Zimbabwe | 95.0 /100 | #119 | Exceptional 97.4% |
| Syrians | 94.8 /100 | #120 | Exceptional 97.4% |
| Immigrants | Norway | 94.7 /100 | #121 | Exceptional 97.4% |
| Immigrants | France | 94.5 /100 | #122 | Exceptional 97.4% |
| Hmong | 94.4 /100 | #123 | Exceptional 97.4% |
| Okinawans | 94.2 /100 | #124 | Exceptional 97.4% |
| Spanish | 93.7 /100 | #125 | Exceptional 97.3% |
| Immigrants | Bulgaria | 93.6 /100 | #126 | Exceptional 97.3% |
| Immigrants | Croatia | 93.1 /100 | #127 | Exceptional 97.3% |
| Immigrants | Romania | 92.0 /100 | #128 | Exceptional 97.3% |
| Immigrants | Serbia | 91.9 /100 | #129 | Exceptional 97.3% |
| Cambodians | 91.8 /100 | #130 | Exceptional 97.3% |
| Immigrants | Europe | 91.1 /100 | #131 | Exceptional 97.3% |
| Palestinians | 90.9 /100 | #132 | Exceptional 97.3% |
| Immigrants | Moldova | 90.0 /100 | #133 | Excellent 97.3% |
Demographics Similar to Croatians by 6th Grade
In terms of 6th grade, the demographic groups most similar to Croatians are Danish (98.0%, a difference of 0.010%), Sioux (98.0%, a difference of 0.010%), Scotch-Irish (98.0%, a difference of 0.010%), Czech (98.0%, a difference of 0.020%), and Lithuanian (98.1%, a difference of 0.030%).
| Demographics | Rating | Rank | 6th Grade |
| Poles | 100.0 /100 | #17 | Exceptional 98.1% |
| Pennsylvania Germans | 100.0 /100 | #18 | Exceptional 98.1% |
| Irish | 100.0 /100 | #19 | Exceptional 98.1% |
| Finns | 100.0 /100 | #20 | Exceptional 98.1% |
| Lithuanians | 100.0 /100 | #21 | Exceptional 98.1% |
| Danes | 100.0 /100 | #22 | Exceptional 98.0% |
| Sioux | 100.0 /100 | #23 | Exceptional 98.0% |
| Croatians | 100.0 /100 | #24 | Exceptional 98.0% |
| Scotch-Irish | 100.0 /100 | #25 | Exceptional 98.0% |
| Czechs | 100.0 /100 | #26 | Exceptional 98.0% |
| Yup'ik | 100.0 /100 | #27 | Exceptional 98.0% |
| Scandinavians | 100.0 /100 | #28 | Exceptional 98.0% |
| French | 100.0 /100 | #29 | Exceptional 98.0% |
| French Canadians | 100.0 /100 | #30 | Exceptional 98.0% |
| Europeans | 100.0 /100 | #31 | Exceptional 98.0% |