Immigrants from Nigeria vs Sri Lankan 12th Grade, No Diploma
COMPARE
Immigrants from Nigeria
Sri Lankan
12th Grade, No Diploma
12th Grade, No Diploma Comparison
Immigrants from Nigeria
Sri Lankans
89.9%
12TH GRADE, NO DIPLOMA
1.3/ 100
METRIC RATING
247th/ 347
METRIC RANK
89.4%
12TH GRADE, NO DIPLOMA
0.2/ 100
METRIC RATING
264th/ 347
METRIC RANK
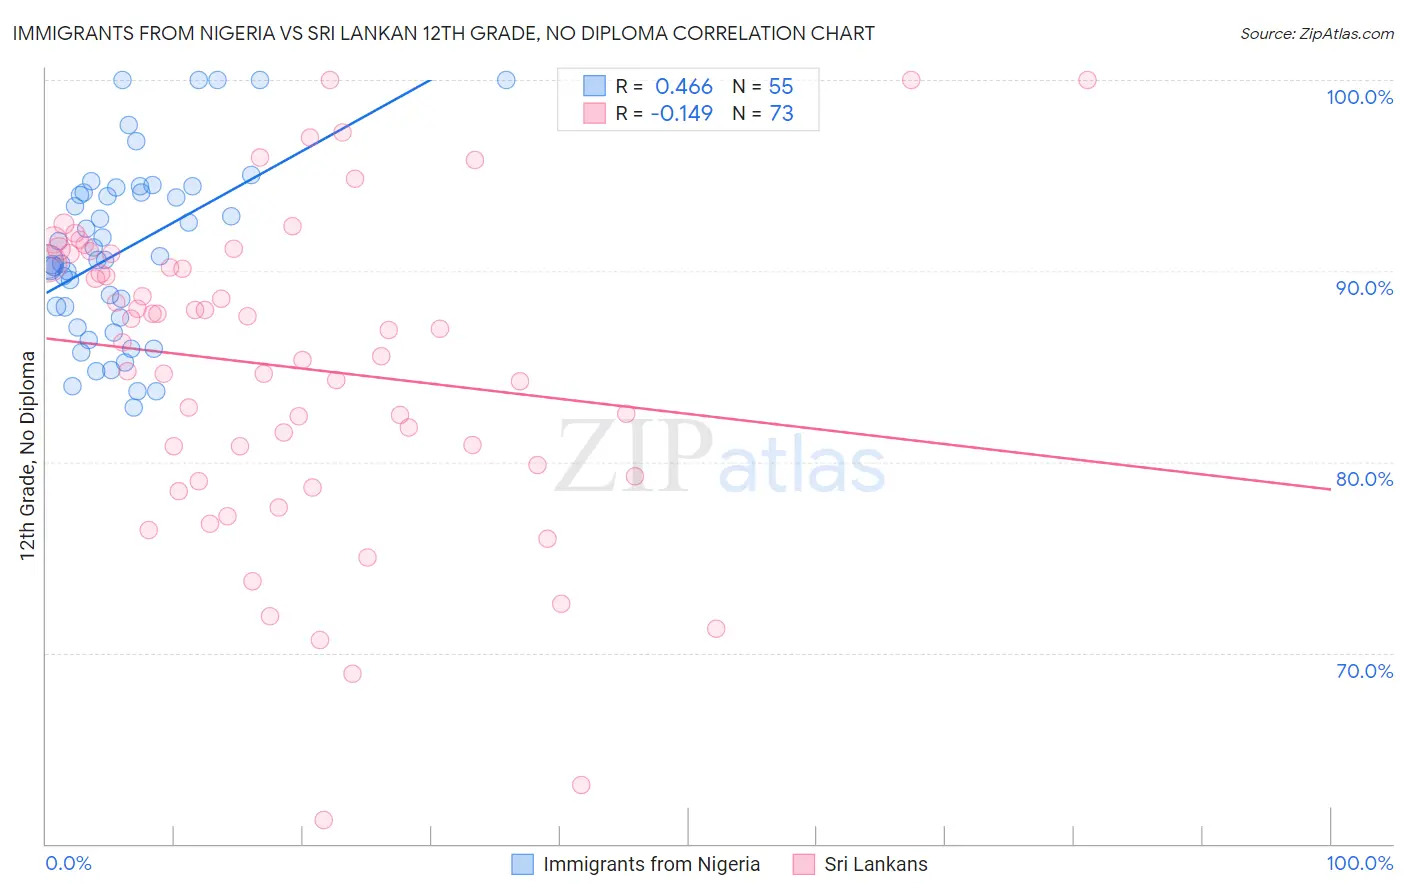
Immigrants from Nigeria vs Sri Lankan 12th Grade, No Diploma Correlation Chart
The statistical analysis conducted on geographies consisting of 283,441,873 people shows a moderate positive correlation between the proportion of Immigrants from Nigeria and percentage of population with at least 12th grade (no diploma) education in the United States with a correlation coefficient (R) of 0.466 and weighted average of 89.9%. Similarly, the statistical analysis conducted on geographies consisting of 440,593,537 people shows a poor negative correlation between the proportion of Sri Lankans and percentage of population with at least 12th grade (no diploma) education in the United States with a correlation coefficient (R) of -0.149 and weighted average of 89.4%, a difference of 0.58%.
12th Grade, No Diploma Correlation Summary
| Measurement | Immigrants from Nigeria | Sri Lankan |
| Minimum | 82.9% | 61.2% |
| Maximum | 100.0% | 100.0% |
| Range | 17.1% | 38.8% |
| Mean | 91.1% | 85.0% |
| Median | 90.6% | 86.9% |
| Interquartile 25% (IQ1) | 87.6% | 79.6% |
| Interquartile 75% (IQ3) | 94.1% | 90.9% |
| Interquartile Range (IQR) | 6.5% | 11.3% |
| Standard Deviation (Sample) | 4.6% | 8.2% |
| Standard Deviation (Population) | 4.5% | 8.2% |
Demographics Similar to Immigrants from Nigeria and Sri Lankans by 12th Grade, No Diploma
In terms of 12th grade, no diploma, the demographic groups most similar to Immigrants from Nigeria are Ghanaian (90.0%, a difference of 0.010%), Immigrants from Uruguay (90.0%, a difference of 0.020%), Comanche (89.9%, a difference of 0.050%), Senegalese (89.9%, a difference of 0.060%), and Immigrants from Eritrea (89.9%, a difference of 0.090%). Similarly, the demographic groups most similar to Sri Lankans are Trinidadian and Tobagonian (89.4%, a difference of 0.010%), Immigrants from Jamaica (89.5%, a difference of 0.040%), Immigrants from South Eastern Asia (89.6%, a difference of 0.19%), Cheyenne (89.6%, a difference of 0.19%), and Sioux (89.6%, a difference of 0.19%).
| Demographics | Rating | Rank | 12th Grade, No Diploma |
| Immigrants | Uruguay | 1.4 /100 | #245 | Tragic 90.0% |
| Ghanaians | 1.3 /100 | #246 | Tragic 90.0% |
| Immigrants | Nigeria | 1.3 /100 | #247 | Tragic 89.9% |
| Comanche | 1.1 /100 | #248 | Tragic 89.9% |
| Senegalese | 1.1 /100 | #249 | Tragic 89.9% |
| Immigrants | Eritrea | 1.0 /100 | #250 | Tragic 89.9% |
| Spanish Americans | 0.9 /100 | #251 | Tragic 89.9% |
| Bahamians | 0.9 /100 | #252 | Tragic 89.9% |
| Choctaw | 0.7 /100 | #253 | Tragic 89.8% |
| Immigrants | Peru | 0.5 /100 | #254 | Tragic 89.7% |
| Immigrants | Senegal | 0.5 /100 | #255 | Tragic 89.7% |
| Immigrants | Ghana | 0.5 /100 | #256 | Tragic 89.7% |
| Jamaicans | 0.5 /100 | #257 | Tragic 89.7% |
| Africans | 0.4 /100 | #258 | Tragic 89.6% |
| Immigrants | Western Africa | 0.4 /100 | #259 | Tragic 89.6% |
| Immigrants | South Eastern Asia | 0.4 /100 | #260 | Tragic 89.6% |
| Cheyenne | 0.4 /100 | #261 | Tragic 89.6% |
| Sioux | 0.4 /100 | #262 | Tragic 89.6% |
| Immigrants | Jamaica | 0.2 /100 | #263 | Tragic 89.5% |
| Sri Lankans | 0.2 /100 | #264 | Tragic 89.4% |
| Trinidadians and Tobagonians | 0.2 /100 | #265 | Tragic 89.4% |