Immigrants from Nicaragua vs Bangladeshi High School Diploma
COMPARE
Immigrants from Nicaragua
Bangladeshi
High School Diploma
High School Diploma Comparison
Immigrants from Nicaragua
Bangladeshis
83.1%
HIGH SCHOOL DIPLOMA
0.0/ 100
METRIC RATING
325th/ 347
METRIC RANK
86.9%
HIGH SCHOOL DIPLOMA
0.1/ 100
METRIC RATING
274th/ 347
METRIC RANK
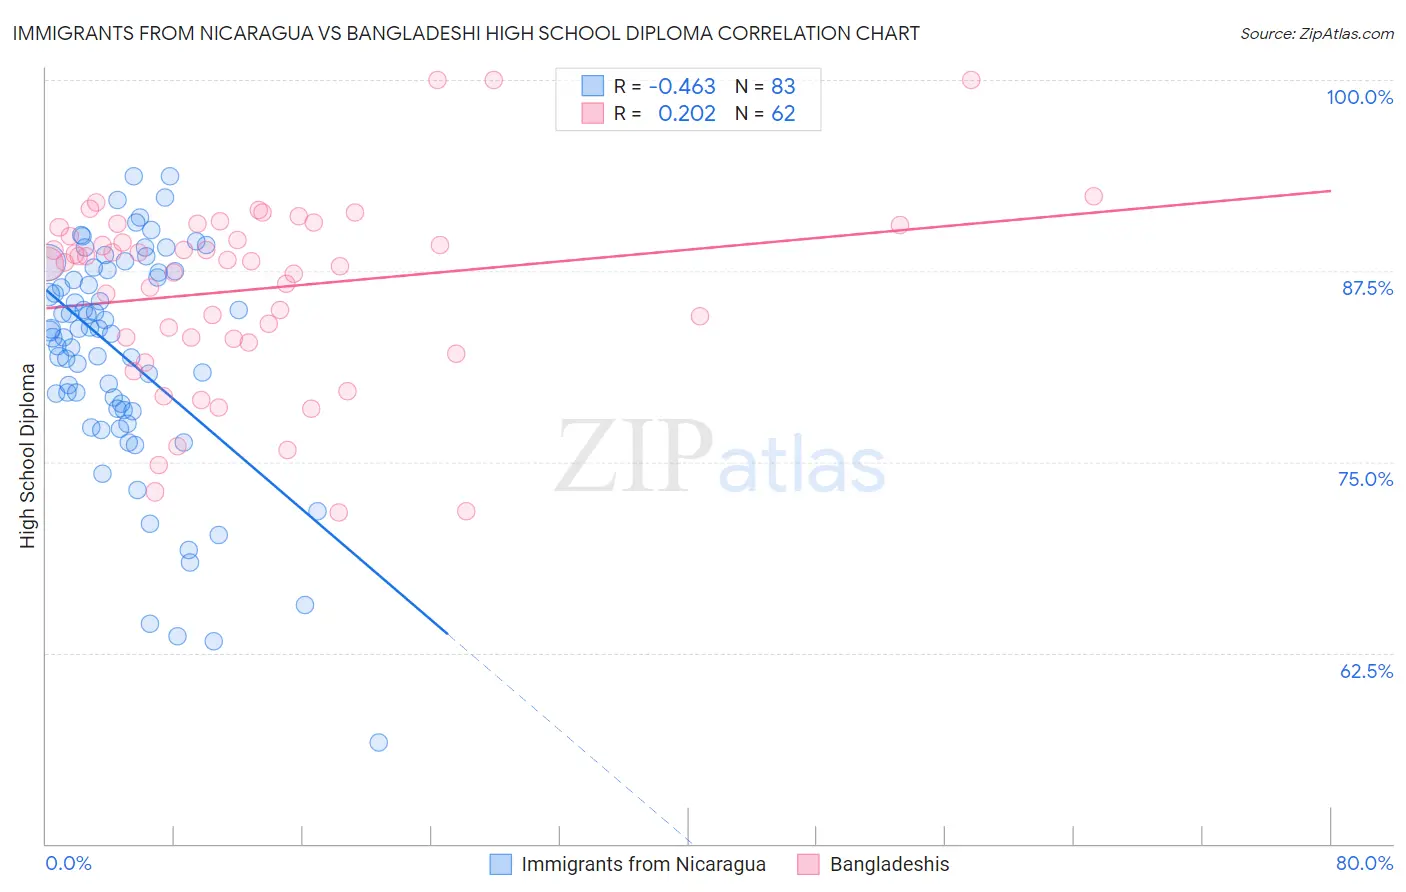
Immigrants from Nicaragua vs Bangladeshi High School Diploma Correlation Chart
The statistical analysis conducted on geographies consisting of 236,340,156 people shows a moderate negative correlation between the proportion of Immigrants from Nicaragua and percentage of population with at least high school diploma education in the United States with a correlation coefficient (R) of -0.463 and weighted average of 83.1%. Similarly, the statistical analysis conducted on geographies consisting of 141,450,108 people shows a weak positive correlation between the proportion of Bangladeshis and percentage of population with at least high school diploma education in the United States with a correlation coefficient (R) of 0.202 and weighted average of 86.9%, a difference of 4.6%.
High School Diploma Correlation Summary
| Measurement | Immigrants from Nicaragua | Bangladeshi |
| Minimum | 56.7% | 71.7% |
| Maximum | 93.7% | 100.0% |
| Range | 37.0% | 28.3% |
| Mean | 81.9% | 86.3% |
| Median | 83.6% | 88.1% |
| Interquartile 25% (IQ1) | 78.4% | 83.1% |
| Interquartile 75% (IQ3) | 87.5% | 90.3% |
| Interquartile Range (IQR) | 9.1% | 7.3% |
| Standard Deviation (Sample) | 7.5% | 6.2% |
| Standard Deviation (Population) | 7.5% | 6.1% |
Similar Demographics by High School Diploma
Demographics Similar to Immigrants from Nicaragua by High School Diploma
In terms of high school diploma, the demographic groups most similar to Immigrants from Nicaragua are Mexican American Indian (83.0%, a difference of 0.070%), Honduran (83.0%, a difference of 0.11%), Dominican (82.9%, a difference of 0.16%), Immigrants from Cabo Verde (83.3%, a difference of 0.23%), and Hispanic or Latino (82.9%, a difference of 0.26%).
| Demographics | Rating | Rank | High School Diploma |
| Immigrants | Belize | 0.0 /100 | #318 | Tragic 84.2% |
| Central American Indians | 0.0 /100 | #319 | Tragic 84.2% |
| Nicaraguans | 0.0 /100 | #320 | Tragic 84.1% |
| Yuman | 0.0 /100 | #321 | Tragic 84.0% |
| Lumbee | 0.0 /100 | #322 | Tragic 83.6% |
| Immigrants | Cuba | 0.0 /100 | #323 | Tragic 83.5% |
| Immigrants | Cabo Verde | 0.0 /100 | #324 | Tragic 83.3% |
| Immigrants | Nicaragua | 0.0 /100 | #325 | Tragic 83.1% |
| Mexican American Indians | 0.0 /100 | #326 | Tragic 83.0% |
| Hondurans | 0.0 /100 | #327 | Tragic 83.0% |
| Dominicans | 0.0 /100 | #328 | Tragic 82.9% |
| Hispanics or Latinos | 0.0 /100 | #329 | Tragic 82.9% |
| Immigrants | Azores | 0.0 /100 | #330 | Tragic 82.8% |
| Central Americans | 0.0 /100 | #331 | Tragic 82.5% |
| Immigrants | Honduras | 0.0 /100 | #332 | Tragic 82.5% |
Demographics Similar to Bangladeshis by High School Diploma
In terms of high school diploma, the demographic groups most similar to Bangladeshis are Immigrants from Jamaica (86.9%, a difference of 0.010%), Trinidadian and Tobagonian (86.9%, a difference of 0.040%), West Indian (86.9%, a difference of 0.050%), Malaysian (87.0%, a difference of 0.12%), and Sri Lankan (87.0%, a difference of 0.13%).
| Demographics | Rating | Rank | High School Diploma |
| Blacks/African Americans | 0.2 /100 | #267 | Tragic 87.0% |
| Pennsylvania Germans | 0.2 /100 | #268 | Tragic 87.0% |
| Sri Lankans | 0.2 /100 | #269 | Tragic 87.0% |
| Malaysians | 0.2 /100 | #270 | Tragic 87.0% |
| West Indians | 0.1 /100 | #271 | Tragic 86.9% |
| Trinidadians and Tobagonians | 0.1 /100 | #272 | Tragic 86.9% |
| Immigrants | Jamaica | 0.1 /100 | #273 | Tragic 86.9% |
| Bangladeshis | 0.1 /100 | #274 | Tragic 86.9% |
| Immigrants | Trinidad and Tobago | 0.1 /100 | #275 | Tragic 86.8% |
| Immigrants | Burma/Myanmar | 0.1 /100 | #276 | Tragic 86.7% |
| Barbadians | 0.1 /100 | #277 | Tragic 86.7% |
| Hopi | 0.1 /100 | #278 | Tragic 86.6% |
| Immigrants | Laos | 0.0 /100 | #279 | Tragic 86.6% |
| Pueblo | 0.0 /100 | #280 | Tragic 86.5% |
| Indonesians | 0.0 /100 | #281 | Tragic 86.5% |