Immigrants from Germany vs Filipino 2nd Grade
COMPARE
Immigrants from Germany
Filipino
2nd Grade
2nd Grade Comparison
Immigrants from Germany
Filipinos
98.2%
2ND GRADE
98.6/ 100
METRIC RATING
94th/ 347
METRIC RANK
98.0%
2ND GRADE
79.2/ 100
METRIC RATING
145th/ 347
METRIC RANK
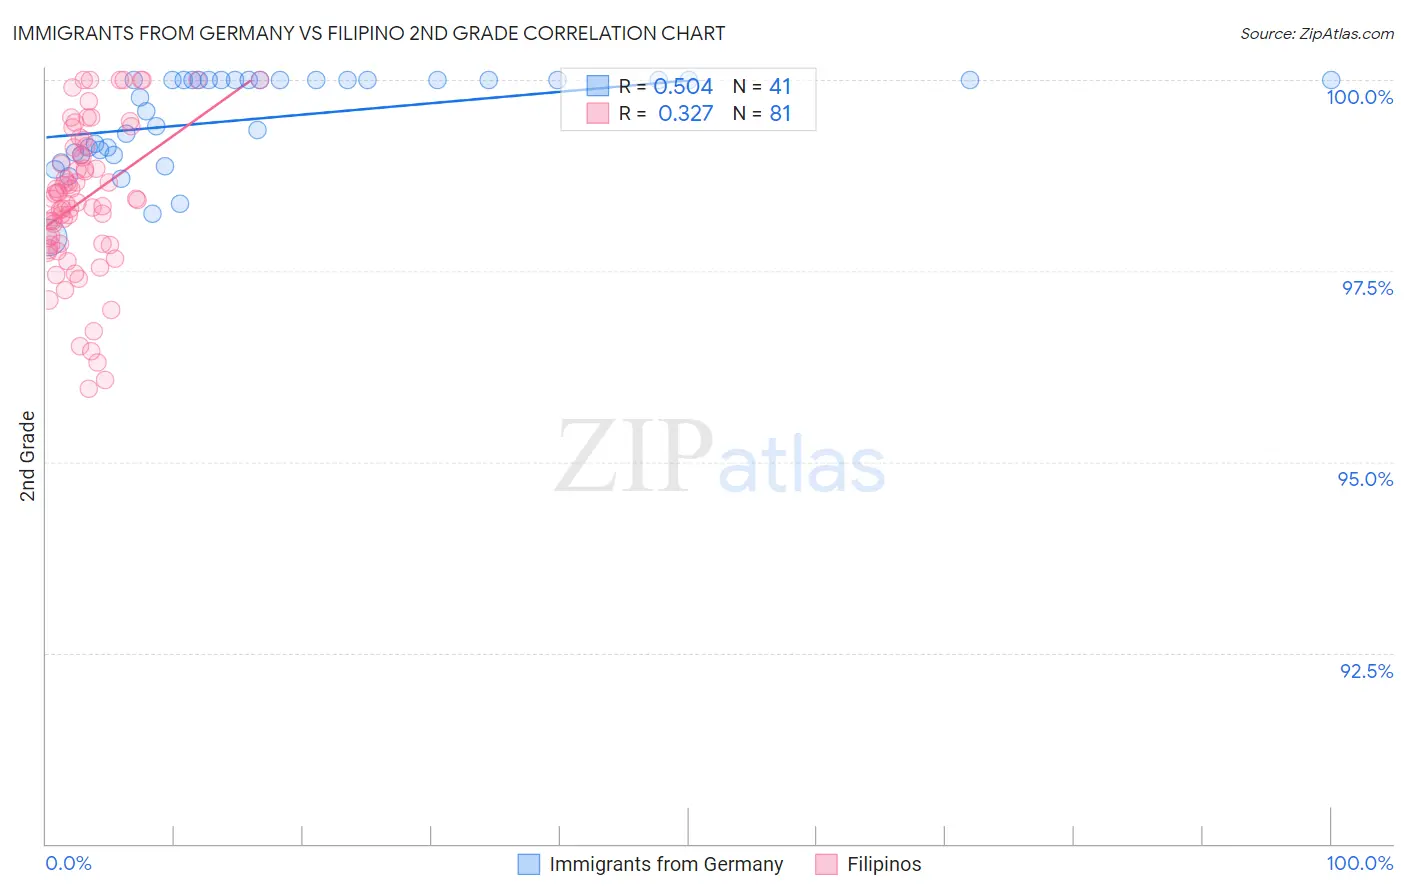
Immigrants from Germany vs Filipino 2nd Grade Correlation Chart
The statistical analysis conducted on geographies consisting of 463,886,643 people shows a substantial positive correlation between the proportion of Immigrants from Germany and percentage of population with at least 2nd grade education in the United States with a correlation coefficient (R) of 0.504 and weighted average of 98.2%. Similarly, the statistical analysis conducted on geographies consisting of 254,351,427 people shows a mild positive correlation between the proportion of Filipinos and percentage of population with at least 2nd grade education in the United States with a correlation coefficient (R) of 0.327 and weighted average of 98.0%, a difference of 0.23%.
2nd Grade Correlation Summary
| Measurement | Immigrants from Germany | Filipino |
| Minimum | 97.9% | 95.9% |
| Maximum | 100.0% | 100.0% |
| Range | 2.1% | 4.1% |
| Mean | 99.5% | 98.4% |
| Median | 100.0% | 98.4% |
| Interquartile 25% (IQ1) | 99.0% | 97.8% |
| Interquartile 75% (IQ3) | 100.0% | 99.1% |
| Interquartile Range (IQR) | 0.96% | 1.3% |
| Standard Deviation (Sample) | 0.60% | 0.97% |
| Standard Deviation (Population) | 0.59% | 0.97% |
Similar Demographics by 2nd Grade
Demographics Similar to Immigrants from Germany by 2nd Grade
In terms of 2nd grade, the demographic groups most similar to Immigrants from Germany are South African (98.2%, a difference of 0.0%), Immigrants from India (98.2%, a difference of 0.010%), Cypriot (98.2%, a difference of 0.010%), Macedonian (98.2%, a difference of 0.020%), and Ukrainian (98.2%, a difference of 0.020%).
| Demographics | Rating | Rank | 2nd Grade |
| Immigrants | Denmark | 99.0 /100 | #87 | Exceptional 98.2% |
| Macedonians | 99.0 /100 | #88 | Exceptional 98.2% |
| Ukrainians | 98.9 /100 | #89 | Exceptional 98.2% |
| Zimbabweans | 98.8 /100 | #90 | Exceptional 98.2% |
| Immigrants | Western Europe | 98.8 /100 | #91 | Exceptional 98.2% |
| Immigrants | South Africa | 98.8 /100 | #92 | Exceptional 98.2% |
| Immigrants | India | 98.8 /100 | #93 | Exceptional 98.2% |
| Immigrants | Germany | 98.6 /100 | #94 | Exceptional 98.2% |
| South Africans | 98.6 /100 | #95 | Exceptional 98.2% |
| Cypriots | 98.4 /100 | #96 | Exceptional 98.2% |
| Choctaw | 98.3 /100 | #97 | Exceptional 98.2% |
| Immigrants | Nonimmigrants | 98.3 /100 | #98 | Exceptional 98.2% |
| Immigrants | Ireland | 98.0 /100 | #99 | Exceptional 98.2% |
| Romanians | 98.0 /100 | #100 | Exceptional 98.2% |
| Puget Sound Salish | 98.0 /100 | #101 | Exceptional 98.2% |
Demographics Similar to Filipinos by 2nd Grade
In terms of 2nd grade, the demographic groups most similar to Filipinos are Hmong (98.0%, a difference of 0.0%), Burmese (98.0%, a difference of 0.010%), Alsatian (98.0%, a difference of 0.010%), Immigrants from Israel (98.0%, a difference of 0.010%), and Immigrants from Greece (98.0%, a difference of 0.010%).
| Demographics | Rating | Rank | 2nd Grade |
| Israelis | 87.9 /100 | #138 | Excellent 98.0% |
| Blackfeet | 87.5 /100 | #139 | Excellent 98.0% |
| Palestinians | 83.9 /100 | #140 | Excellent 98.0% |
| Immigrants | Turkey | 83.0 /100 | #141 | Excellent 98.0% |
| Burmese | 81.0 /100 | #142 | Excellent 98.0% |
| Alsatians | 80.5 /100 | #143 | Excellent 98.0% |
| Hmong | 80.0 /100 | #144 | Good 98.0% |
| Filipinos | 79.2 /100 | #145 | Good 98.0% |
| Immigrants | Israel | 78.0 /100 | #146 | Good 98.0% |
| Immigrants | Greece | 76.8 /100 | #147 | Good 98.0% |
| Jordanians | 74.5 /100 | #148 | Good 98.0% |
| Apache | 74.0 /100 | #149 | Good 97.9% |
| Immigrants | Moldova | 72.9 /100 | #150 | Good 97.9% |
| Soviet Union | 70.7 /100 | #151 | Good 97.9% |
| Immigrants | North Macedonia | 68.5 /100 | #152 | Good 97.9% |