Immigrants from Netherlands vs Immigrants from Lebanon 9th Grade
COMPARE
Immigrants from Netherlands
Immigrants from Lebanon
9th Grade
9th Grade Comparison
Immigrants from Netherlands
Immigrants from Lebanon
95.8%
9TH GRADE
99.6/ 100
METRIC RATING
66th/ 347
METRIC RANK
94.7%
9TH GRADE
27.2/ 100
METRIC RATING
196th/ 347
METRIC RANK
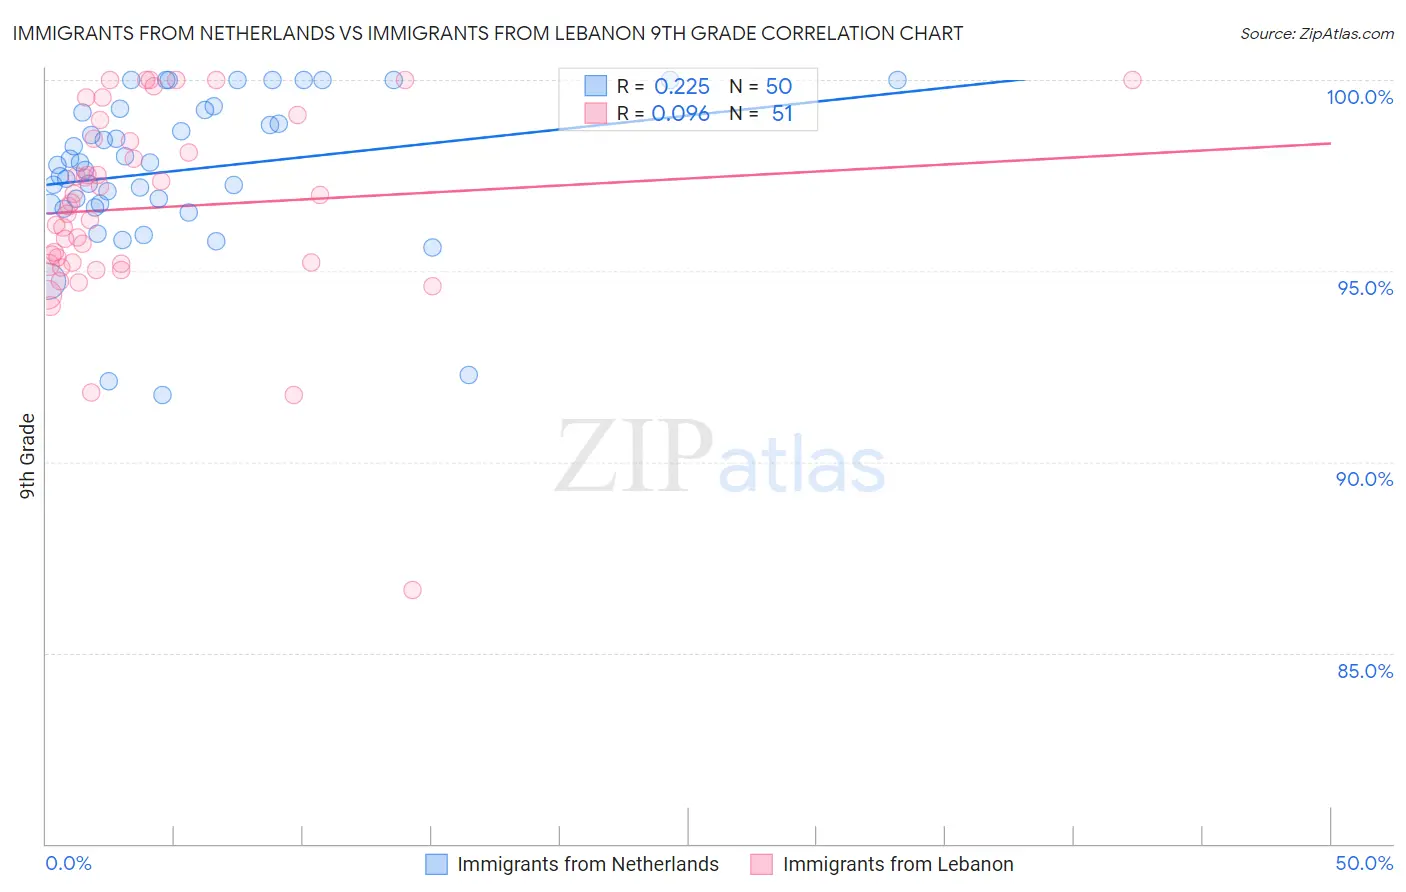
Immigrants from Netherlands vs Immigrants from Lebanon 9th Grade Correlation Chart
The statistical analysis conducted on geographies consisting of 237,869,934 people shows a weak positive correlation between the proportion of Immigrants from Netherlands and percentage of population with at least 9th grade education in the United States with a correlation coefficient (R) of 0.225 and weighted average of 95.8%. Similarly, the statistical analysis conducted on geographies consisting of 217,083,357 people shows a slight positive correlation between the proportion of Immigrants from Lebanon and percentage of population with at least 9th grade education in the United States with a correlation coefficient (R) of 0.096 and weighted average of 94.7%, a difference of 1.2%.
9th Grade Correlation Summary
| Measurement | Immigrants from Netherlands | Immigrants from Lebanon |
| Minimum | 91.8% | 86.6% |
| Maximum | 100.0% | 100.0% |
| Range | 8.2% | 13.4% |
| Mean | 97.6% | 96.7% |
| Median | 97.8% | 96.7% |
| Interquartile 25% (IQ1) | 96.7% | 95.2% |
| Interquartile 75% (IQ3) | 99.2% | 98.4% |
| Interquartile Range (IQR) | 2.5% | 3.3% |
| Standard Deviation (Sample) | 2.0% | 2.6% |
| Standard Deviation (Population) | 2.0% | 2.5% |
Similar Demographics by 9th Grade
Demographics Similar to Immigrants from Netherlands by 9th Grade
In terms of 9th grade, the demographic groups most similar to Immigrants from Netherlands are Cypriot (95.8%, a difference of 0.010%), Immigrants from Ireland (95.8%, a difference of 0.010%), Immigrants from Lithuania (95.8%, a difference of 0.010%), Immigrants from England (95.9%, a difference of 0.020%), and Zimbabwean (95.9%, a difference of 0.030%).
| Demographics | Rating | Rank | 9th Grade |
| New Zealanders | 99.8 /100 | #59 | Exceptional 95.9% |
| Native Hawaiians | 99.8 /100 | #60 | Exceptional 95.9% |
| Sioux | 99.8 /100 | #61 | Exceptional 95.9% |
| Ukrainians | 99.7 /100 | #62 | Exceptional 95.9% |
| Canadians | 99.7 /100 | #63 | Exceptional 95.9% |
| Zimbabweans | 99.7 /100 | #64 | Exceptional 95.9% |
| Immigrants | England | 99.6 /100 | #65 | Exceptional 95.9% |
| Immigrants | Netherlands | 99.6 /100 | #66 | Exceptional 95.8% |
| Cypriots | 99.6 /100 | #67 | Exceptional 95.8% |
| Immigrants | Ireland | 99.6 /100 | #68 | Exceptional 95.8% |
| Immigrants | Lithuania | 99.6 /100 | #69 | Exceptional 95.8% |
| Immigrants | Australia | 99.5 /100 | #70 | Exceptional 95.8% |
| Immigrants | Belgium | 99.5 /100 | #71 | Exceptional 95.8% |
| Turks | 99.5 /100 | #72 | Exceptional 95.8% |
| Immigrants | Singapore | 99.5 /100 | #73 | Exceptional 95.8% |
Demographics Similar to Immigrants from Lebanon by 9th Grade
In terms of 9th grade, the demographic groups most similar to Immigrants from Lebanon are Marshallese (94.7%, a difference of 0.010%), Panamanian (94.7%, a difference of 0.020%), Immigrants from Micronesia (94.7%, a difference of 0.020%), Immigrants from Northern Africa (94.7%, a difference of 0.030%), and Paraguayan (94.7%, a difference of 0.030%).
| Demographics | Rating | Rank | 9th Grade |
| Immigrants | Argentina | 34.4 /100 | #189 | Fair 94.8% |
| Sudanese | 32.7 /100 | #190 | Fair 94.7% |
| Assyrians/Chaldeans/Syriacs | 32.0 /100 | #191 | Fair 94.7% |
| Immigrants | Northern Africa | 30.7 /100 | #192 | Fair 94.7% |
| Paraguayans | 30.1 /100 | #193 | Fair 94.7% |
| Panamanians | 29.0 /100 | #194 | Fair 94.7% |
| Marshallese | 27.9 /100 | #195 | Fair 94.7% |
| Immigrants | Lebanon | 27.2 /100 | #196 | Fair 94.7% |
| Immigrants | Micronesia | 24.7 /100 | #197 | Fair 94.7% |
| Hawaiians | 22.7 /100 | #198 | Fair 94.7% |
| Laotians | 21.0 /100 | #199 | Fair 94.6% |
| Immigrants | Zaire | 20.6 /100 | #200 | Fair 94.6% |
| Blacks/African Americans | 20.5 /100 | #201 | Fair 94.6% |
| Immigrants | Eastern Asia | 19.8 /100 | #202 | Poor 94.6% |
| Immigrants | Bahamas | 19.8 /100 | #203 | Poor 94.6% |