Immigrants from Netherlands vs Chilean Unemployment Among Ages 25 to 29 years
COMPARE
Immigrants from Netherlands
Chilean
Unemployment Among Ages 25 to 29 years
Unemployment Among Ages 25 to 29 years Comparison
Immigrants from Netherlands
Chileans
6.2%
UNEMPLOYMENT AMONG AGES 25 TO 29 YEARS
98.7/ 100
METRIC RATING
55th/ 347
METRIC RANK
6.5%
UNEMPLOYMENT AMONG AGES 25 TO 29 YEARS
85.3/ 100
METRIC RATING
118th/ 347
METRIC RANK
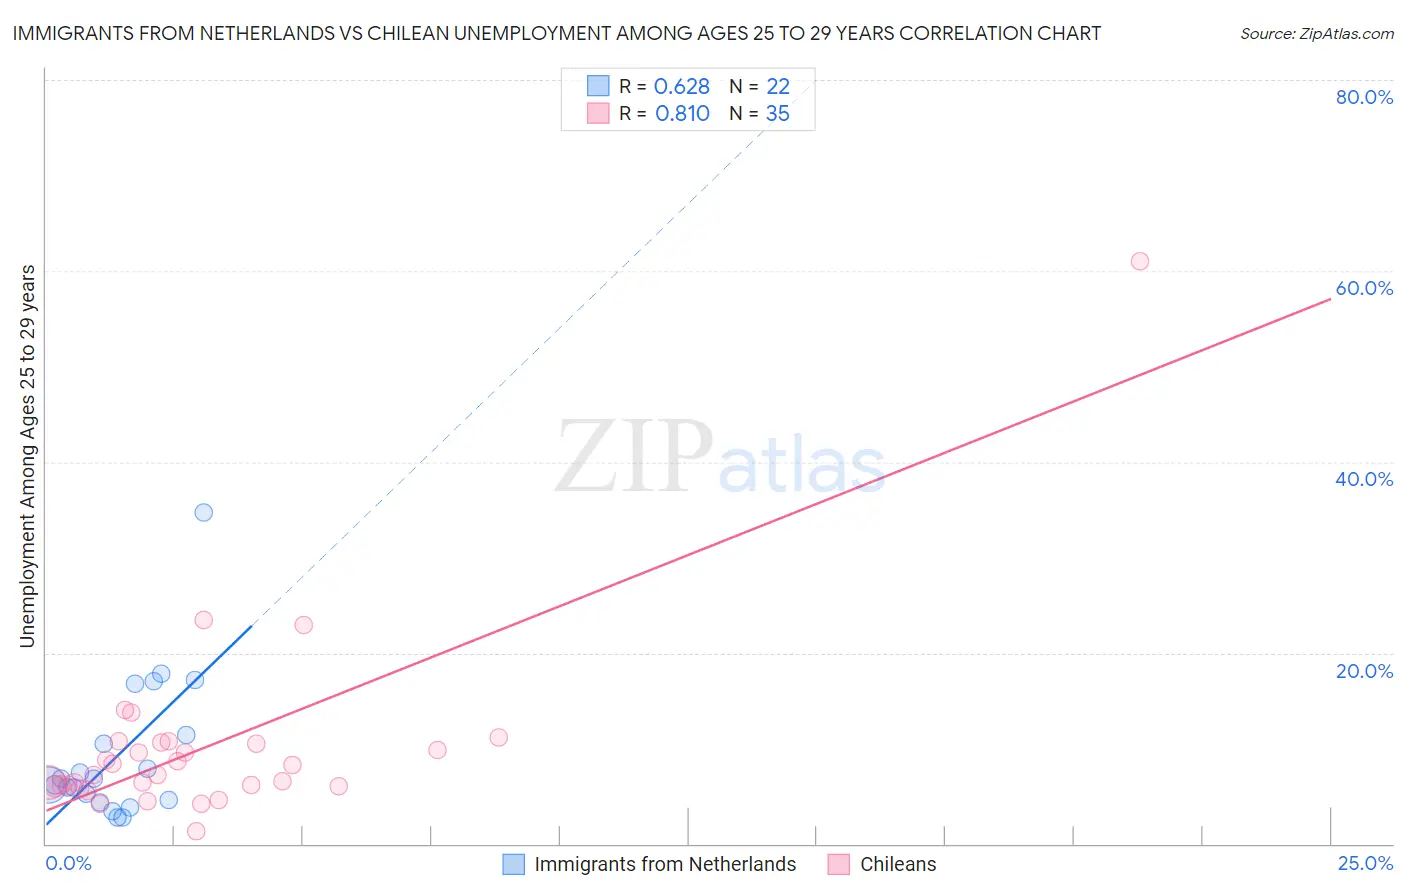
Immigrants from Netherlands vs Chilean Unemployment Among Ages 25 to 29 years Correlation Chart
The statistical analysis conducted on geographies consisting of 229,136,153 people shows a significant positive correlation between the proportion of Immigrants from Netherlands and unemployment rate among population between the ages 25 and 29 in the United States with a correlation coefficient (R) of 0.628 and weighted average of 6.2%. Similarly, the statistical analysis conducted on geographies consisting of 249,568,746 people shows a very strong positive correlation between the proportion of Chileans and unemployment rate among population between the ages 25 and 29 in the United States with a correlation coefficient (R) of 0.810 and weighted average of 6.5%, a difference of 4.2%.
Unemployment Among Ages 25 to 29 years Correlation Summary
| Measurement | Immigrants from Netherlands | Chilean |
| Minimum | 2.8% | 1.3% |
| Maximum | 34.7% | 61.0% |
| Range | 31.9% | 59.7% |
| Mean | 9.3% | 10.1% |
| Median | 6.5% | 7.2% |
| Interquartile 25% (IQ1) | 4.6% | 6.1% |
| Interquartile 75% (IQ3) | 11.3% | 10.6% |
| Interquartile Range (IQR) | 6.7% | 4.5% |
| Standard Deviation (Sample) | 7.5% | 10.0% |
| Standard Deviation (Population) | 7.3% | 9.8% |
Similar Demographics by Unemployment Among Ages 25 to 29 years
Demographics Similar to Immigrants from Netherlands by Unemployment Among Ages 25 to 29 years
In terms of unemployment among ages 25 to 29 years, the demographic groups most similar to Immigrants from Netherlands are Immigrants from Burma/Myanmar (6.2%, a difference of 0.020%), Immigrants from Saudi Arabia (6.2%, a difference of 0.11%), Swedish (6.2%, a difference of 0.18%), Turkish (6.2%, a difference of 0.20%), and Immigrants from Turkey (6.2%, a difference of 0.26%).
| Demographics | Rating | Rank | Unemployment Among Ages 25 to 29 years |
| Immigrants | Australia | 99.0 /100 | #48 | Exceptional 6.2% |
| German Russians | 99.0 /100 | #49 | Exceptional 6.2% |
| Soviet Union | 98.9 /100 | #50 | Exceptional 6.2% |
| Burmese | 98.9 /100 | #51 | Exceptional 6.2% |
| Immigrants | Turkey | 98.9 /100 | #52 | Exceptional 6.2% |
| Turks | 98.8 /100 | #53 | Exceptional 6.2% |
| Swedes | 98.8 /100 | #54 | Exceptional 6.2% |
| Immigrants | Netherlands | 98.7 /100 | #55 | Exceptional 6.2% |
| Immigrants | Burma/Myanmar | 98.7 /100 | #56 | Exceptional 6.2% |
| Immigrants | Saudi Arabia | 98.6 /100 | #57 | Exceptional 6.2% |
| Immigrants | Eastern Asia | 98.4 /100 | #58 | Exceptional 6.2% |
| Luxembourgers | 98.3 /100 | #59 | Exceptional 6.2% |
| Immigrants | Taiwan | 98.3 /100 | #60 | Exceptional 6.2% |
| Bhutanese | 98.2 /100 | #61 | Exceptional 6.2% |
| Immigrants | China | 98.1 /100 | #62 | Exceptional 6.2% |
Demographics Similar to Chileans by Unemployment Among Ages 25 to 29 years
In terms of unemployment among ages 25 to 29 years, the demographic groups most similar to Chileans are Immigrants from Uruguay (6.5%, a difference of 0.050%), Immigrants from South Africa (6.5%, a difference of 0.050%), Pakistani (6.5%, a difference of 0.070%), Immigrants from Moldova (6.5%, a difference of 0.10%), and Immigrants from Uganda (6.5%, a difference of 0.10%).
| Demographics | Rating | Rank | Unemployment Among Ages 25 to 29 years |
| Immigrants | Colombia | 87.6 /100 | #111 | Excellent 6.4% |
| Immigrants | Nicaragua | 87.5 /100 | #112 | Excellent 6.4% |
| Immigrants | Egypt | 87.1 /100 | #113 | Excellent 6.5% |
| Germans | 86.3 /100 | #114 | Excellent 6.5% |
| Macedonians | 86.1 /100 | #115 | Excellent 6.5% |
| Pakistanis | 85.9 /100 | #116 | Excellent 6.5% |
| Immigrants | Uruguay | 85.7 /100 | #117 | Excellent 6.5% |
| Chileans | 85.3 /100 | #118 | Excellent 6.5% |
| Immigrants | South Africa | 84.9 /100 | #119 | Excellent 6.5% |
| Immigrants | Moldova | 84.5 /100 | #120 | Excellent 6.5% |
| Immigrants | Uganda | 84.5 /100 | #121 | Excellent 6.5% |
| Immigrants | Belarus | 83.7 /100 | #122 | Excellent 6.5% |
| Laotians | 83.6 /100 | #123 | Excellent 6.5% |
| Arabs | 82.5 /100 | #124 | Excellent 6.5% |
| Syrians | 82.1 /100 | #125 | Excellent 6.5% |