Immigrants from Netherlands vs Immigrants from Croatia 8th Grade
COMPARE
Immigrants from Netherlands
Immigrants from Croatia
8th Grade
8th Grade Comparison
Immigrants from Netherlands
Immigrants from Croatia
96.5%
8TH GRADE
99.4/ 100
METRIC RATING
76th/ 347
METRIC RANK
96.2%
8TH GRADE
96.0/ 100
METRIC RATING
117th/ 347
METRIC RANK
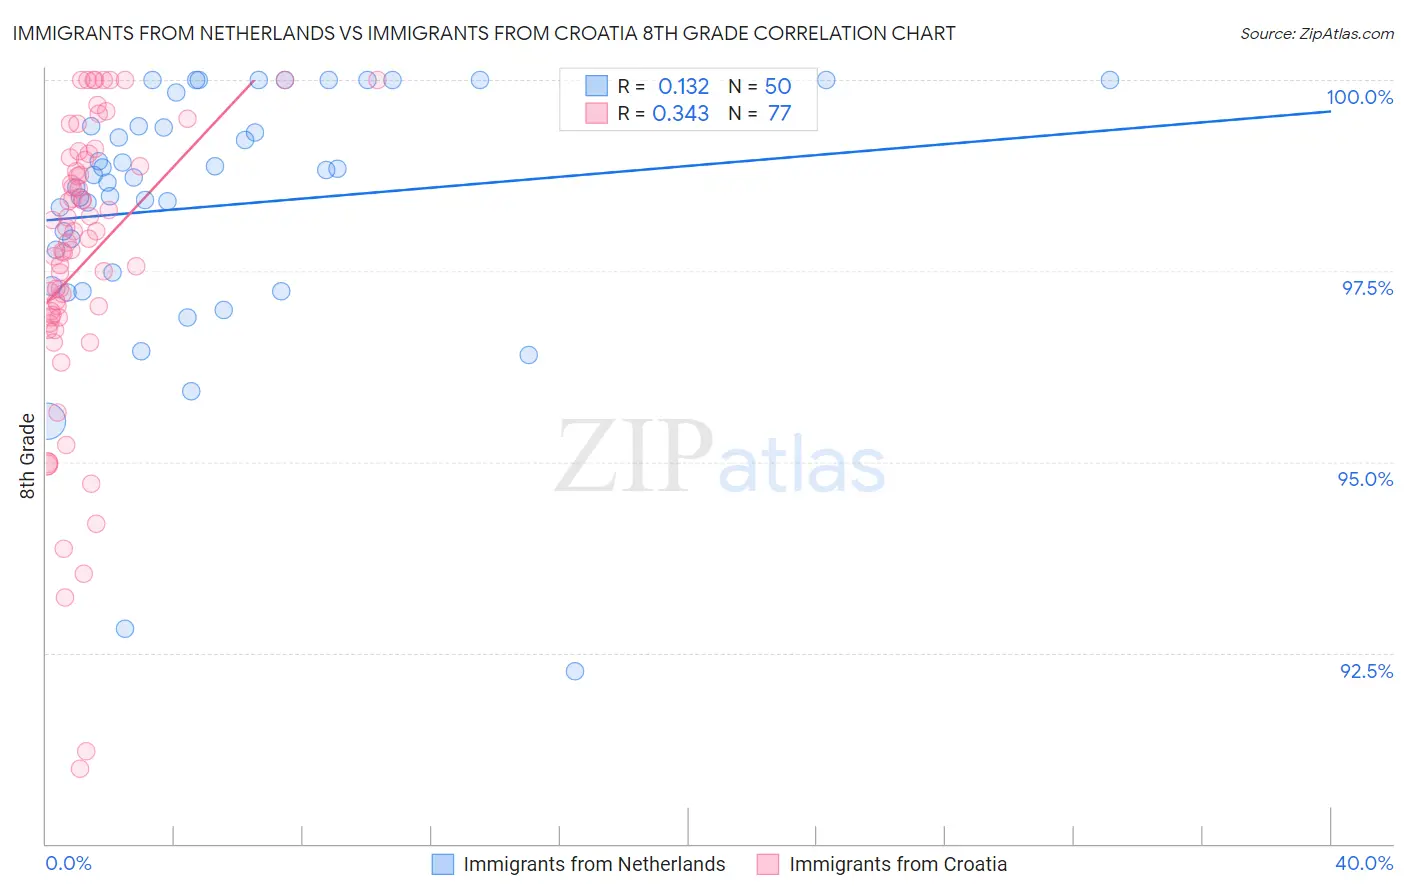
Immigrants from Netherlands vs Immigrants from Croatia 8th Grade Correlation Chart
The statistical analysis conducted on geographies consisting of 237,869,934 people shows a poor positive correlation between the proportion of Immigrants from Netherlands and percentage of population with at least 8th grade education in the United States with a correlation coefficient (R) of 0.132 and weighted average of 96.5%. Similarly, the statistical analysis conducted on geographies consisting of 132,548,291 people shows a mild positive correlation between the proportion of Immigrants from Croatia and percentage of population with at least 8th grade education in the United States with a correlation coefficient (R) of 0.343 and weighted average of 96.2%, a difference of 0.32%.
8th Grade Correlation Summary
| Measurement | Immigrants from Netherlands | Immigrants from Croatia |
| Minimum | 92.3% | 91.0% |
| Maximum | 100.0% | 100.0% |
| Range | 7.7% | 9.0% |
| Mean | 98.4% | 97.6% |
| Median | 98.7% | 97.9% |
| Interquartile 25% (IQ1) | 97.5% | 96.9% |
| Interquartile 75% (IQ3) | 99.4% | 99.0% |
| Interquartile Range (IQR) | 1.9% | 2.1% |
| Standard Deviation (Sample) | 1.7% | 2.0% |
| Standard Deviation (Population) | 1.7% | 1.9% |
Similar Demographics by 8th Grade
Demographics Similar to Immigrants from Netherlands by 8th Grade
In terms of 8th grade, the demographic groups most similar to Immigrants from Netherlands are Zimbabwean (96.5%, a difference of 0.0%), Cypriot (96.5%, a difference of 0.0%), Immigrants from Ireland (96.5%, a difference of 0.010%), Yugoslavian (96.5%, a difference of 0.010%), and New Zealander (96.6%, a difference of 0.020%).
| Demographics | Rating | Rank | 8th Grade |
| Americans | 99.7 /100 | #69 | Exceptional 96.6% |
| Immigrants | Lithuania | 99.6 /100 | #70 | Exceptional 96.6% |
| New Zealanders | 99.5 /100 | #71 | Exceptional 96.6% |
| Immigrants | England | 99.5 /100 | #72 | Exceptional 96.6% |
| Arapaho | 99.5 /100 | #73 | Exceptional 96.6% |
| Immigrants | Ireland | 99.5 /100 | #74 | Exceptional 96.5% |
| Zimbabweans | 99.4 /100 | #75 | Exceptional 96.5% |
| Immigrants | Netherlands | 99.4 /100 | #76 | Exceptional 96.5% |
| Cypriots | 99.4 /100 | #77 | Exceptional 96.5% |
| Yugoslavians | 99.4 /100 | #78 | Exceptional 96.5% |
| Puget Sound Salish | 99.3 /100 | #79 | Exceptional 96.5% |
| Delaware | 99.2 /100 | #80 | Exceptional 96.5% |
| Romanians | 99.2 /100 | #81 | Exceptional 96.5% |
| Turks | 99.2 /100 | #82 | Exceptional 96.5% |
| Icelanders | 99.2 /100 | #83 | Exceptional 96.5% |
Demographics Similar to Immigrants from Croatia by 8th Grade
In terms of 8th grade, the demographic groups most similar to Immigrants from Croatia are Nonimmigrants (96.2%, a difference of 0.0%), Immigrants from Norway (96.2%, a difference of 0.010%), Immigrants from Japan (96.2%, a difference of 0.020%), Immigrants from Moldova (96.2%, a difference of 0.020%), and Syrian (96.3%, a difference of 0.030%).
| Demographics | Rating | Rank | 8th Grade |
| Cajuns | 97.1 /100 | #110 | Exceptional 96.3% |
| Shoshone | 96.8 /100 | #111 | Exceptional 96.3% |
| Syrians | 96.7 /100 | #112 | Exceptional 96.3% |
| Immigrants | Zimbabwe | 96.7 /100 | #113 | Exceptional 96.3% |
| Immigrants | Japan | 96.5 /100 | #114 | Exceptional 96.2% |
| Immigrants | Moldova | 96.5 /100 | #115 | Exceptional 96.2% |
| Immigrants | Nonimmigrants | 96.0 /100 | #116 | Exceptional 96.2% |
| Immigrants | Croatia | 96.0 /100 | #117 | Exceptional 96.2% |
| Immigrants | Norway | 95.7 /100 | #118 | Exceptional 96.2% |
| Immigrants | Switzerland | 95.3 /100 | #119 | Exceptional 96.2% |
| Immigrants | France | 95.3 /100 | #120 | Exceptional 96.2% |
| Immigrants | Bulgaria | 95.3 /100 | #121 | Exceptional 96.2% |
| Immigrants | Europe | 95.3 /100 | #122 | Exceptional 96.2% |
| Filipinos | 94.6 /100 | #123 | Exceptional 96.2% |
| Palestinians | 94.6 /100 | #124 | Exceptional 96.2% |