Immigrants from Mexico vs Carpatho Rusyn 6th Grade
COMPARE
Immigrants from Mexico
Carpatho Rusyn
6th Grade
6th Grade Comparison
Immigrants from Mexico
Carpatho Rusyns
93.9%
6TH GRADE
0.0/ 100
METRIC RATING
343rd/ 347
METRIC RANK
98.1%
6TH GRADE
100.0/ 100
METRIC RATING
14th/ 347
METRIC RANK
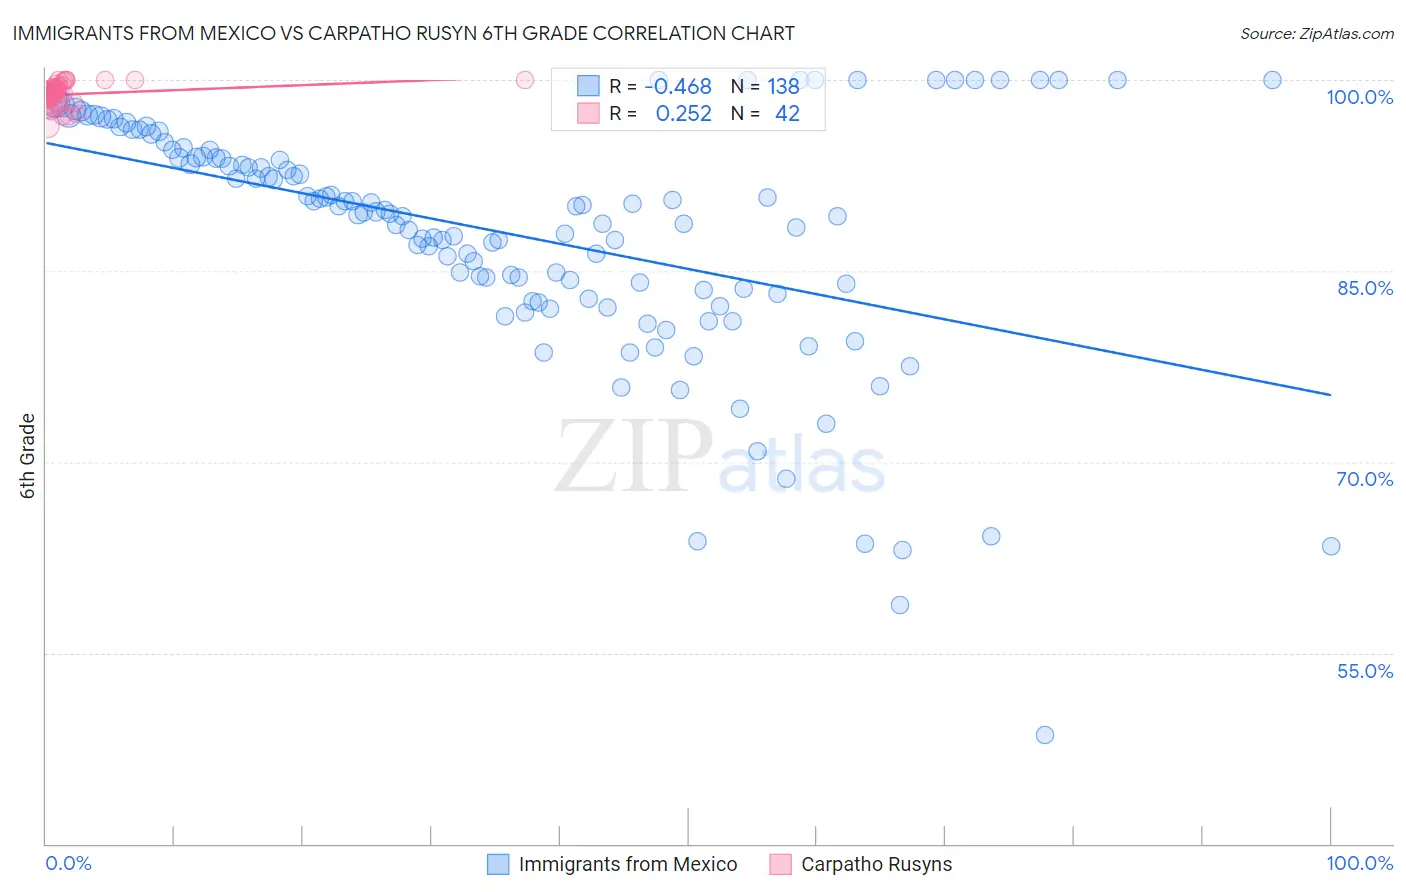
Immigrants from Mexico vs Carpatho Rusyn 6th Grade Correlation Chart
The statistical analysis conducted on geographies consisting of 513,767,713 people shows a moderate negative correlation between the proportion of Immigrants from Mexico and percentage of population with at least 6th grade education in the United States with a correlation coefficient (R) of -0.468 and weighted average of 93.9%. Similarly, the statistical analysis conducted on geographies consisting of 58,871,690 people shows a weak positive correlation between the proportion of Carpatho Rusyns and percentage of population with at least 6th grade education in the United States with a correlation coefficient (R) of 0.252 and weighted average of 98.1%, a difference of 4.4%.
6th Grade Correlation Summary
| Measurement | Immigrants from Mexico | Carpatho Rusyn |
| Minimum | 48.6% | 96.4% |
| Maximum | 100.0% | 100.0% |
| Range | 51.4% | 3.6% |
| Mean | 88.0% | 98.9% |
| Median | 89.6% | 99.0% |
| Interquartile 25% (IQ1) | 83.5% | 98.4% |
| Interquartile 75% (IQ3) | 94.5% | 99.5% |
| Interquartile Range (IQR) | 11.0% | 1.1% |
| Standard Deviation (Sample) | 9.5% | 0.89% |
| Standard Deviation (Population) | 9.4% | 0.88% |
Similar Demographics by 6th Grade
Demographics Similar to Immigrants from Mexico by 6th Grade
In terms of 6th grade, the demographic groups most similar to Immigrants from Mexico are Immigrants from Guatemala (93.9%, a difference of 0.0%), Salvadoran (93.9%, a difference of 0.010%), Immigrants from Central America (94.0%, a difference of 0.060%), Immigrants from Yemen (94.1%, a difference of 0.16%), and Guatemalan (94.2%, a difference of 0.28%).
| Demographics | Rating | Rank | 6th Grade |
| Immigrants | Latin America | 0.0 /100 | #333 | Tragic 94.7% |
| Immigrants | Azores | 0.0 /100 | #334 | Tragic 94.7% |
| Mexicans | 0.0 /100 | #335 | Tragic 94.6% |
| Immigrants | Dominican Republic | 0.0 /100 | #336 | Tragic 94.6% |
| Central Americans | 0.0 /100 | #337 | Tragic 94.5% |
| Immigrants | Cabo Verde | 0.0 /100 | #338 | Tragic 94.4% |
| Yakama | 0.0 /100 | #339 | Tragic 94.3% |
| Guatemalans | 0.0 /100 | #340 | Tragic 94.2% |
| Immigrants | Yemen | 0.0 /100 | #341 | Tragic 94.1% |
| Immigrants | Central America | 0.0 /100 | #342 | Tragic 94.0% |
| Immigrants | Mexico | 0.0 /100 | #343 | Tragic 93.9% |
| Immigrants | Guatemala | 0.0 /100 | #344 | Tragic 93.9% |
| Salvadorans | 0.0 /100 | #345 | Tragic 93.9% |
| Spanish American Indians | 0.0 /100 | #346 | Tragic 93.6% |
| Immigrants | El Salvador | 0.0 /100 | #347 | Tragic 93.6% |
Demographics Similar to Carpatho Rusyns by 6th Grade
In terms of 6th grade, the demographic groups most similar to Carpatho Rusyns are Tlingit-Haida (98.1%, a difference of 0.010%), Inupiat (98.1%, a difference of 0.010%), Scottish (98.1%, a difference of 0.010%), Alaskan Athabascan (98.1%, a difference of 0.020%), and Polish (98.1%, a difference of 0.020%).
| Demographics | Rating | Rank | 6th Grade |
| Germans | 100.0 /100 | #7 | Exceptional 98.2% |
| Slovaks | 100.0 /100 | #8 | Exceptional 98.2% |
| Slovenes | 100.0 /100 | #9 | Exceptional 98.2% |
| Swedes | 100.0 /100 | #10 | Exceptional 98.2% |
| English | 100.0 /100 | #11 | Exceptional 98.1% |
| Alaskan Athabascans | 100.0 /100 | #12 | Exceptional 98.1% |
| Tlingit-Haida | 100.0 /100 | #13 | Exceptional 98.1% |
| Carpatho Rusyns | 100.0 /100 | #14 | Exceptional 98.1% |
| Inupiat | 100.0 /100 | #15 | Exceptional 98.1% |
| Scottish | 100.0 /100 | #16 | Exceptional 98.1% |
| Poles | 100.0 /100 | #17 | Exceptional 98.1% |
| Pennsylvania Germans | 100.0 /100 | #18 | Exceptional 98.1% |
| Irish | 100.0 /100 | #19 | Exceptional 98.1% |
| Finns | 100.0 /100 | #20 | Exceptional 98.1% |
| Lithuanians | 100.0 /100 | #21 | Exceptional 98.1% |