Immigrants from Moldova vs Nonimmigrants Professional Degree
COMPARE
Immigrants from Moldova
Nonimmigrants
Professional Degree
Professional Degree Comparison
Immigrants from Moldova
Nonimmigrants
4.9%
PROFESSIONAL DEGREE
94.8/ 100
METRIC RATING
121st/ 347
METRIC RANK
3.9%
PROFESSIONAL DEGREE
4.0/ 100
METRIC RATING
234th/ 347
METRIC RANK
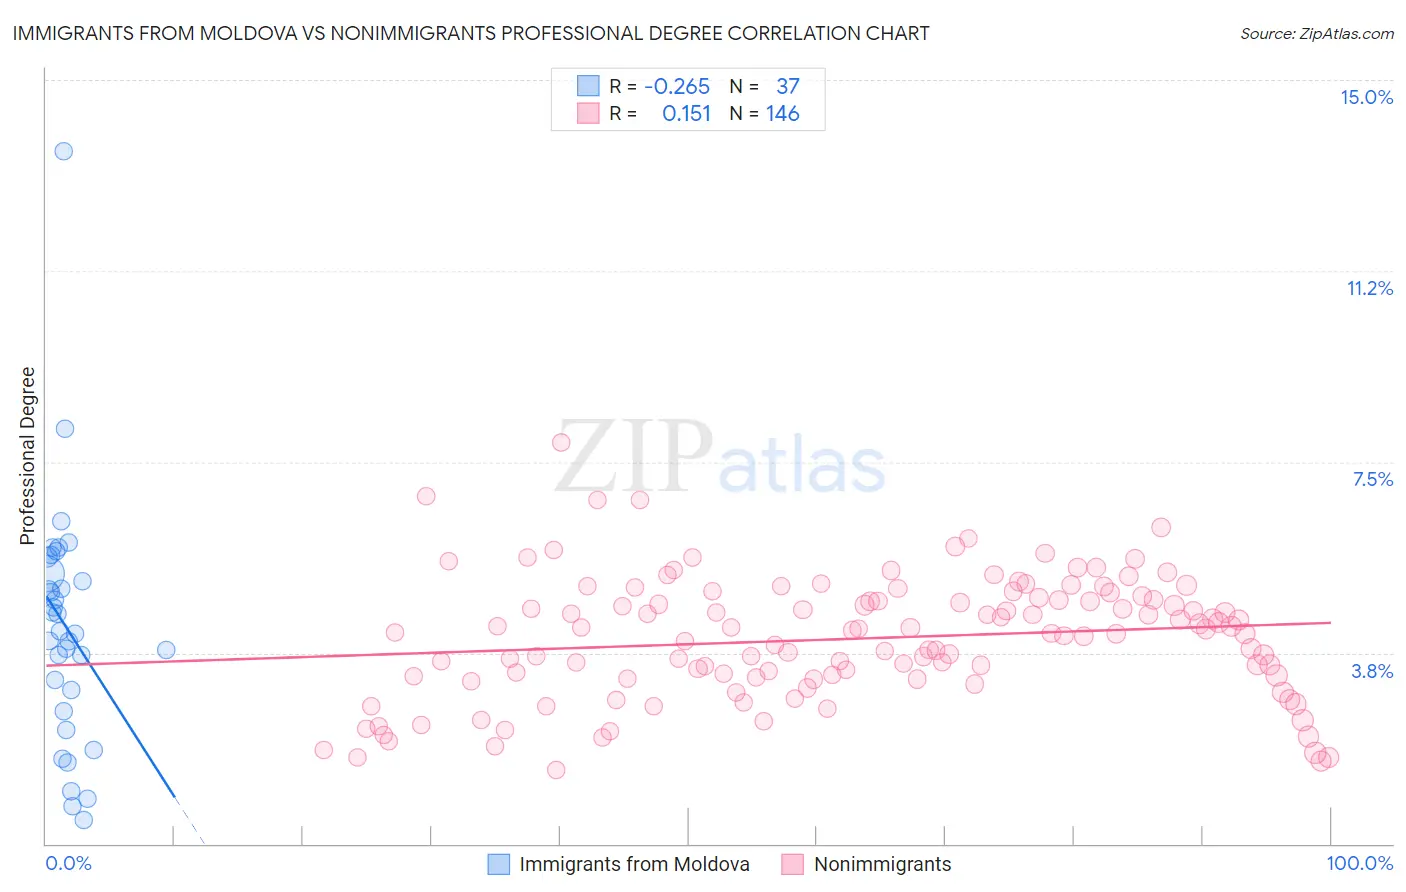
Immigrants from Moldova vs Nonimmigrants Professional Degree Correlation Chart
The statistical analysis conducted on geographies consisting of 124,337,930 people shows a weak negative correlation between the proportion of Immigrants from Moldova and percentage of population with at least professional degree education in the United States with a correlation coefficient (R) of -0.265 and weighted average of 4.9%. Similarly, the statistical analysis conducted on geographies consisting of 572,440,292 people shows a poor positive correlation between the proportion of Nonimmigrants and percentage of population with at least professional degree education in the United States with a correlation coefficient (R) of 0.151 and weighted average of 3.9%, a difference of 24.9%.
Professional Degree Correlation Summary
| Measurement | Immigrants from Moldova | Nonimmigrants |
| Minimum | 0.45% | 1.4% |
| Maximum | 13.6% | 7.9% |
| Range | 13.1% | 6.4% |
| Mean | 4.2% | 4.0% |
| Median | 4.2% | 4.1% |
| Interquartile 25% (IQ1) | 2.8% | 3.3% |
| Interquartile 75% (IQ3) | 5.5% | 4.8% |
| Interquartile Range (IQR) | 2.7% | 1.5% |
| Standard Deviation (Sample) | 2.4% | 1.2% |
| Standard Deviation (Population) | 2.3% | 1.2% |
Similar Demographics by Professional Degree
Demographics Similar to Immigrants from Moldova by Professional Degree
In terms of professional degree, the demographic groups most similar to Immigrants from Moldova are Albanian (4.9%, a difference of 0.35%), Immigrants from Sudan (4.9%, a difference of 0.36%), Immigrants from Germany (4.9%, a difference of 0.46%), Immigrants from Venezuela (4.8%, a difference of 0.63%), and Immigrants from Eritrea (4.8%, a difference of 0.82%).
| Demographics | Rating | Rank | Professional Degree |
| Immigrants | Morocco | 96.8 /100 | #114 | Exceptional 5.0% |
| Moroccans | 96.8 /100 | #115 | Exceptional 5.0% |
| Venezuelans | 96.3 /100 | #116 | Exceptional 4.9% |
| Immigrants | Syria | 96.0 /100 | #117 | Exceptional 4.9% |
| Croatians | 96.0 /100 | #118 | Exceptional 4.9% |
| Immigrants | Sudan | 95.4 /100 | #119 | Exceptional 4.9% |
| Albanians | 95.3 /100 | #120 | Exceptional 4.9% |
| Immigrants | Moldova | 94.8 /100 | #121 | Exceptional 4.9% |
| Immigrants | Germany | 94.1 /100 | #122 | Exceptional 4.9% |
| Immigrants | Venezuela | 93.8 /100 | #123 | Exceptional 4.8% |
| Immigrants | Eritrea | 93.5 /100 | #124 | Exceptional 4.8% |
| Immigrants | Albania | 93.3 /100 | #125 | Exceptional 4.8% |
| Europeans | 93.2 /100 | #126 | Exceptional 4.8% |
| Serbians | 92.6 /100 | #127 | Exceptional 4.8% |
| Immigrants | Eastern Africa | 92.5 /100 | #128 | Exceptional 4.8% |
Demographics Similar to Nonimmigrants by Professional Degree
In terms of professional degree, the demographic groups most similar to Nonimmigrants are Immigrants from Barbados (3.9%, a difference of 0.010%), Immigrants from Philippines (3.9%, a difference of 0.050%), Spanish American (3.9%, a difference of 0.23%), Cree (3.9%, a difference of 0.30%), and Immigrants from Trinidad and Tobago (3.9%, a difference of 0.30%).
| Demographics | Rating | Rank | Professional Degree |
| Cubans | 5.9 /100 | #227 | Tragic 4.0% |
| Immigrants | West Indies | 5.6 /100 | #228 | Tragic 4.0% |
| Immigrants | Burma/Myanmar | 5.4 /100 | #229 | Tragic 3.9% |
| Nicaraguans | 5.1 /100 | #230 | Tragic 3.9% |
| Ecuadorians | 4.6 /100 | #231 | Tragic 3.9% |
| Cree | 4.3 /100 | #232 | Tragic 3.9% |
| Immigrants | Philippines | 4.1 /100 | #233 | Tragic 3.9% |
| Immigrants | Nonimmigrants | 4.0 /100 | #234 | Tragic 3.9% |
| Immigrants | Barbados | 4.0 /100 | #235 | Tragic 3.9% |
| Spanish Americans | 3.8 /100 | #236 | Tragic 3.9% |
| Immigrants | Trinidad and Tobago | 3.8 /100 | #237 | Tragic 3.9% |
| Colville | 2.6 /100 | #238 | Tragic 3.8% |
| British West Indians | 2.4 /100 | #239 | Tragic 3.8% |
| Immigrants | Ecuador | 2.3 /100 | #240 | Tragic 3.8% |
| Alaskan Athabascans | 2.3 /100 | #241 | Tragic 3.8% |