Immigrants from Moldova vs Belgian Nursery School
COMPARE
Immigrants from Moldova
Belgian
Nursery School
Nursery School Comparison
Immigrants from Moldova
Belgians
98.0%
NURSERY SCHOOL
69.6/ 100
METRIC RATING
153rd/ 347
METRIC RANK
98.5%
NURSERY SCHOOL
99.9/ 100
METRIC RATING
44th/ 347
METRIC RANK
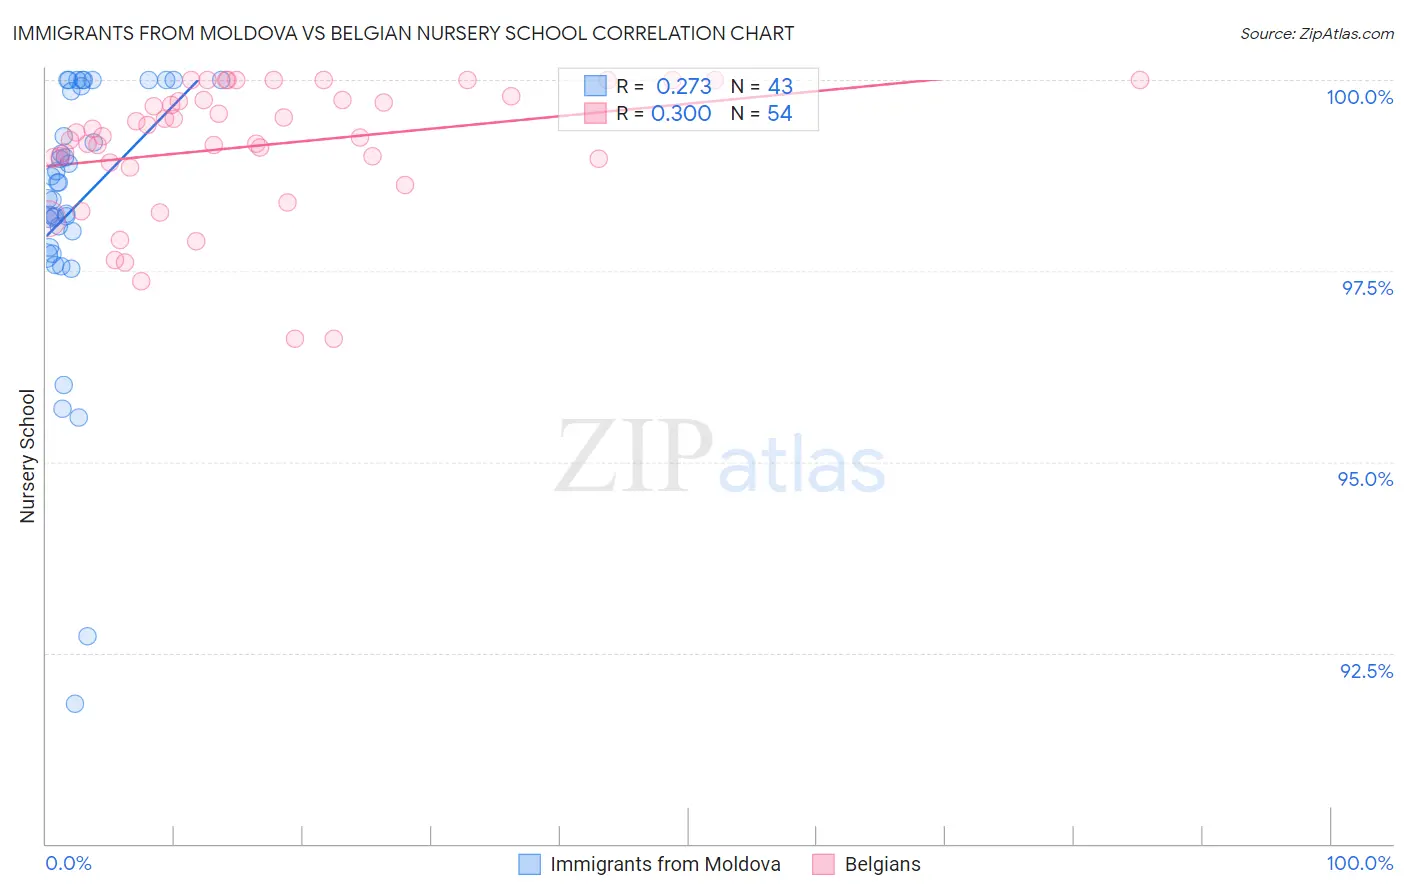
Immigrants from Moldova vs Belgian Nursery School Correlation Chart
The statistical analysis conducted on geographies consisting of 124,398,501 people shows a weak positive correlation between the proportion of Immigrants from Moldova and percentage of population with at least nursery school education in the United States with a correlation coefficient (R) of 0.273 and weighted average of 98.0%. Similarly, the statistical analysis conducted on geographies consisting of 356,016,627 people shows a weak positive correlation between the proportion of Belgians and percentage of population with at least nursery school education in the United States with a correlation coefficient (R) of 0.300 and weighted average of 98.5%, a difference of 0.46%.
Nursery School Correlation Summary
| Measurement | Immigrants from Moldova | Belgian |
| Minimum | 91.8% | 96.6% |
| Maximum | 100.0% | 100.0% |
| Range | 8.2% | 3.4% |
| Mean | 98.3% | 99.1% |
| Median | 98.7% | 99.3% |
| Interquartile 25% (IQ1) | 97.8% | 98.9% |
| Interquartile 75% (IQ3) | 99.9% | 99.7% |
| Interquartile Range (IQR) | 2.1% | 0.82% |
| Standard Deviation (Sample) | 1.8% | 0.86% |
| Standard Deviation (Population) | 1.8% | 0.85% |
Similar Demographics by Nursery School
Demographics Similar to Immigrants from Moldova by Nursery School
In terms of nursery school, the demographic groups most similar to Immigrants from Moldova are Dutch West Indian (98.0%, a difference of 0.0%), Immigrants from Iran (98.0%, a difference of 0.0%), Apache (98.1%, a difference of 0.010%), Jordanian (98.1%, a difference of 0.010%), and Soviet Union (98.0%, a difference of 0.010%).
| Demographics | Rating | Rank | Nursery School |
| Filipinos | 78.5 /100 | #146 | Good 98.1% |
| Hmong | 75.7 /100 | #147 | Good 98.1% |
| Immigrants | Greece | 75.4 /100 | #148 | Good 98.1% |
| Apache | 73.2 /100 | #149 | Good 98.1% |
| Jordanians | 72.9 /100 | #150 | Good 98.1% |
| Soviet Union | 71.6 /100 | #151 | Good 98.0% |
| Dutch West Indians | 70.2 /100 | #152 | Good 98.0% |
| Immigrants | Moldova | 69.6 /100 | #153 | Good 98.0% |
| Immigrants | Iran | 68.7 /100 | #154 | Good 98.0% |
| Immigrants | South Central Asia | 66.7 /100 | #155 | Good 98.0% |
| Venezuelans | 66.6 /100 | #156 | Good 98.0% |
| Comanche | 66.0 /100 | #157 | Good 98.0% |
| Immigrants | North Macedonia | 65.7 /100 | #158 | Good 98.0% |
| French American Indians | 62.1 /100 | #159 | Good 98.0% |
| Immigrants | Russia | 59.9 /100 | #160 | Average 98.0% |
Demographics Similar to Belgians by Nursery School
In terms of nursery school, the demographic groups most similar to Belgians are Northern European (98.5%, a difference of 0.0%), Luxembourger (98.5%, a difference of 0.010%), Eastern European (98.5%, a difference of 0.010%), Native Hawaiian (98.5%, a difference of 0.010%), and Latvian (98.5%, a difference of 0.020%).
| Demographics | Rating | Rank | Nursery School |
| Lumbee | 99.9 /100 | #37 | Exceptional 98.5% |
| Italians | 99.9 /100 | #38 | Exceptional 98.5% |
| Latvians | 99.9 /100 | #39 | Exceptional 98.5% |
| Chippewa | 99.9 /100 | #40 | Exceptional 98.5% |
| Luxembourgers | 99.9 /100 | #41 | Exceptional 98.5% |
| Eastern Europeans | 99.9 /100 | #42 | Exceptional 98.5% |
| Native Hawaiians | 99.9 /100 | #43 | Exceptional 98.5% |
| Belgians | 99.9 /100 | #44 | Exceptional 98.5% |
| Northern Europeans | 99.9 /100 | #45 | Exceptional 98.5% |
| Hungarians | 99.9 /100 | #46 | Exceptional 98.5% |
| Czechoslovakians | 99.9 /100 | #47 | Exceptional 98.5% |
| Ottawa | 99.8 /100 | #48 | Exceptional 98.5% |
| Whites/Caucasians | 99.8 /100 | #49 | Exceptional 98.5% |
| Celtics | 99.8 /100 | #50 | Exceptional 98.5% |
| Estonians | 99.8 /100 | #51 | Exceptional 98.5% |