Scottish vs Belgian Nursery School
COMPARE
Scottish
Belgian
Nursery School
Nursery School Comparison
Scottish
Belgians
98.7%
NURSERY SCHOOL
100.0/ 100
METRIC RATING
16th/ 347
METRIC RANK
98.5%
NURSERY SCHOOL
99.9/ 100
METRIC RATING
44th/ 347
METRIC RANK
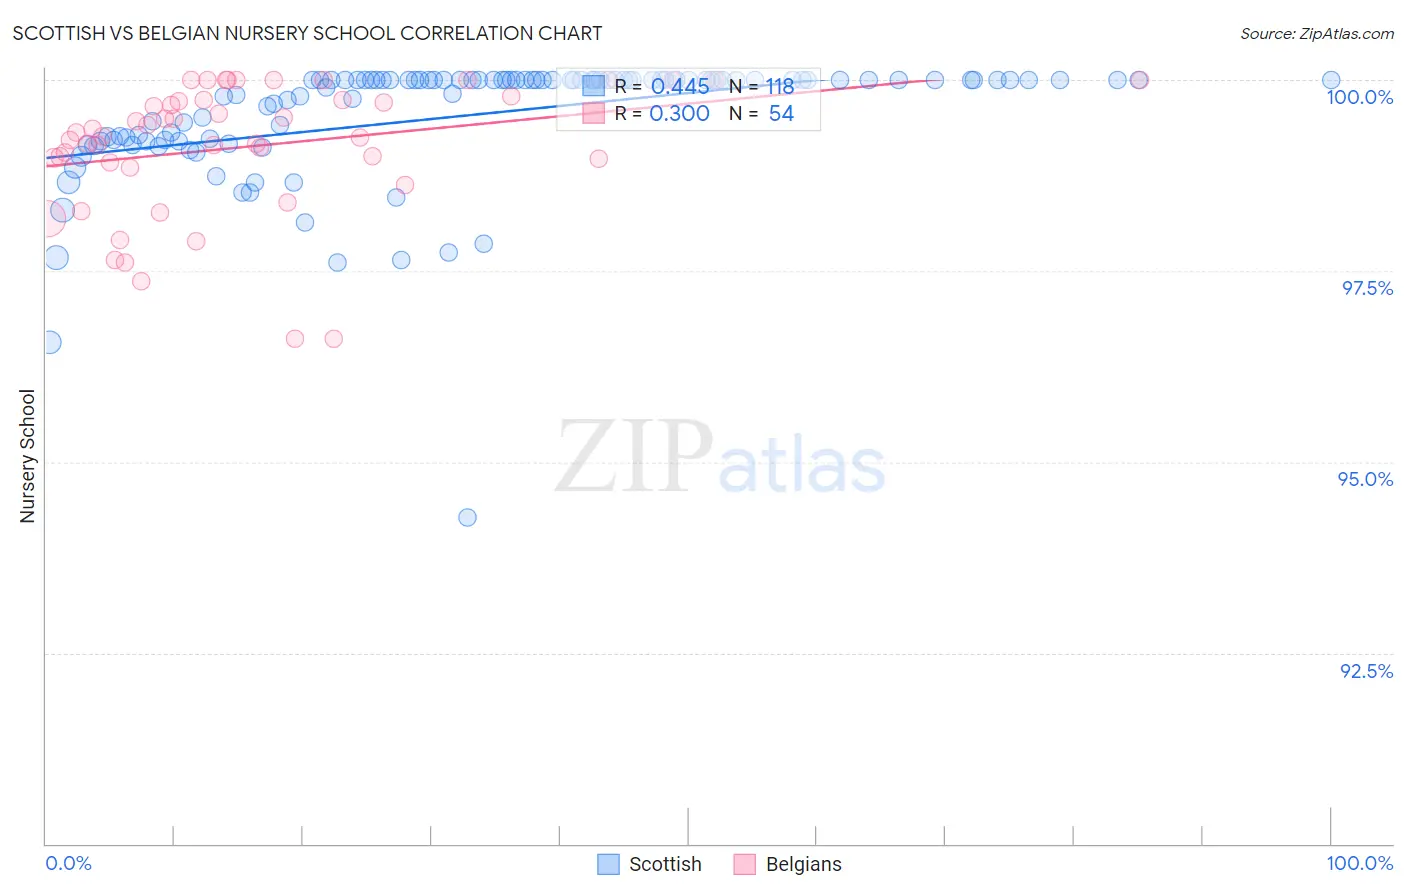
Scottish vs Belgian Nursery School Correlation Chart
The statistical analysis conducted on geographies consisting of 567,141,733 people shows a moderate positive correlation between the proportion of Scottish and percentage of population with at least nursery school education in the United States with a correlation coefficient (R) of 0.445 and weighted average of 98.7%. Similarly, the statistical analysis conducted on geographies consisting of 356,016,627 people shows a weak positive correlation between the proportion of Belgians and percentage of population with at least nursery school education in the United States with a correlation coefficient (R) of 0.300 and weighted average of 98.5%, a difference of 0.17%.
Nursery School Correlation Summary
| Measurement | Scottish | Belgian |
| Minimum | 94.3% | 96.6% |
| Maximum | 100.0% | 100.0% |
| Range | 5.7% | 3.4% |
| Mean | 99.5% | 99.1% |
| Median | 100.0% | 99.3% |
| Interquartile 25% (IQ1) | 99.2% | 98.9% |
| Interquartile 75% (IQ3) | 100.0% | 99.7% |
| Interquartile Range (IQR) | 0.79% | 0.82% |
| Standard Deviation (Sample) | 0.83% | 0.86% |
| Standard Deviation (Population) | 0.83% | 0.85% |
Similar Demographics by Nursery School
Demographics Similar to Scottish by Nursery School
In terms of nursery school, the demographic groups most similar to Scottish are Aleut (98.7%, a difference of 0.0%), Swedish (98.7%, a difference of 0.010%), Dutch (98.7%, a difference of 0.010%), English (98.7%, a difference of 0.030%), and Carpatho Rusyn (98.7%, a difference of 0.030%).
| Demographics | Rating | Rank | Nursery School |
| Slovaks | 100.0 /100 | #9 | Exceptional 98.7% |
| Germans | 100.0 /100 | #10 | Exceptional 98.7% |
| Tlingit-Haida | 100.0 /100 | #11 | Exceptional 98.7% |
| Slovenes | 100.0 /100 | #12 | Exceptional 98.7% |
| English | 100.0 /100 | #13 | Exceptional 98.7% |
| Carpatho Rusyns | 100.0 /100 | #14 | Exceptional 98.7% |
| Swedes | 100.0 /100 | #15 | Exceptional 98.7% |
| Scottish | 100.0 /100 | #16 | Exceptional 98.7% |
| Aleuts | 100.0 /100 | #17 | Exceptional 98.7% |
| Dutch | 100.0 /100 | #18 | Exceptional 98.7% |
| Irish | 100.0 /100 | #19 | Exceptional 98.6% |
| Pennsylvania Germans | 100.0 /100 | #20 | Exceptional 98.6% |
| Finns | 100.0 /100 | #21 | Exceptional 98.6% |
| Lithuanians | 100.0 /100 | #22 | Exceptional 98.6% |
| Poles | 100.0 /100 | #23 | Exceptional 98.6% |
Demographics Similar to Belgians by Nursery School
In terms of nursery school, the demographic groups most similar to Belgians are Northern European (98.5%, a difference of 0.0%), Luxembourger (98.5%, a difference of 0.010%), Eastern European (98.5%, a difference of 0.010%), Native Hawaiian (98.5%, a difference of 0.010%), and Latvian (98.5%, a difference of 0.020%).
| Demographics | Rating | Rank | Nursery School |
| Lumbee | 99.9 /100 | #37 | Exceptional 98.5% |
| Italians | 99.9 /100 | #38 | Exceptional 98.5% |
| Latvians | 99.9 /100 | #39 | Exceptional 98.5% |
| Chippewa | 99.9 /100 | #40 | Exceptional 98.5% |
| Luxembourgers | 99.9 /100 | #41 | Exceptional 98.5% |
| Eastern Europeans | 99.9 /100 | #42 | Exceptional 98.5% |
| Native Hawaiians | 99.9 /100 | #43 | Exceptional 98.5% |
| Belgians | 99.9 /100 | #44 | Exceptional 98.5% |
| Northern Europeans | 99.9 /100 | #45 | Exceptional 98.5% |
| Hungarians | 99.9 /100 | #46 | Exceptional 98.5% |
| Czechoslovakians | 99.9 /100 | #47 | Exceptional 98.5% |
| Ottawa | 99.8 /100 | #48 | Exceptional 98.5% |
| Whites/Caucasians | 99.8 /100 | #49 | Exceptional 98.5% |
| Celtics | 99.8 /100 | #50 | Exceptional 98.5% |
| Estonians | 99.8 /100 | #51 | Exceptional 98.5% |